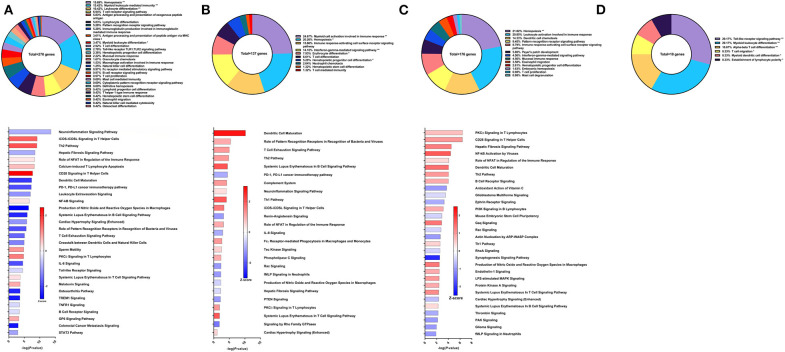
Figure 2.
RNA-Seq analysis of Sm-p80-VR1020, a DNA vaccine strategy. (A) PBMCs after vaccination (Top) Gene ontology enrichment analysis represented as a pie graph of percentages of genes per group out of a total number of differentially expressed genes. “**” and “*” indicates P < 0.05 and P < 0.01, respectively. (Bottom) Canonical pathway analysis generated using IPA. Bars are plotted based on the – log10(P-value) and colored based on predicted activation (red) and deactivation/inhibition (blue) according to the Z-score, a composite assessment based on the degree of overlap between directional expression of genes from the observed data and the Qiagen-curated public database. The top 30 pathways are shown based on the lowest P-values. (B) PBMCs after challenge (Top) Gene ontology enrichment analysis. (Bottom) Canonical pathway analysis generated using IPA. (C) Spleen cells (Top) Gene ontology enrichment analysis. (Bottom) Canonical pathway analysis generated using IPA. (D) Mesenteric lymph node cells (Top) Gene ontology enrichment analysis. Bottom) Canonical pathway analysis generated using IPA.

