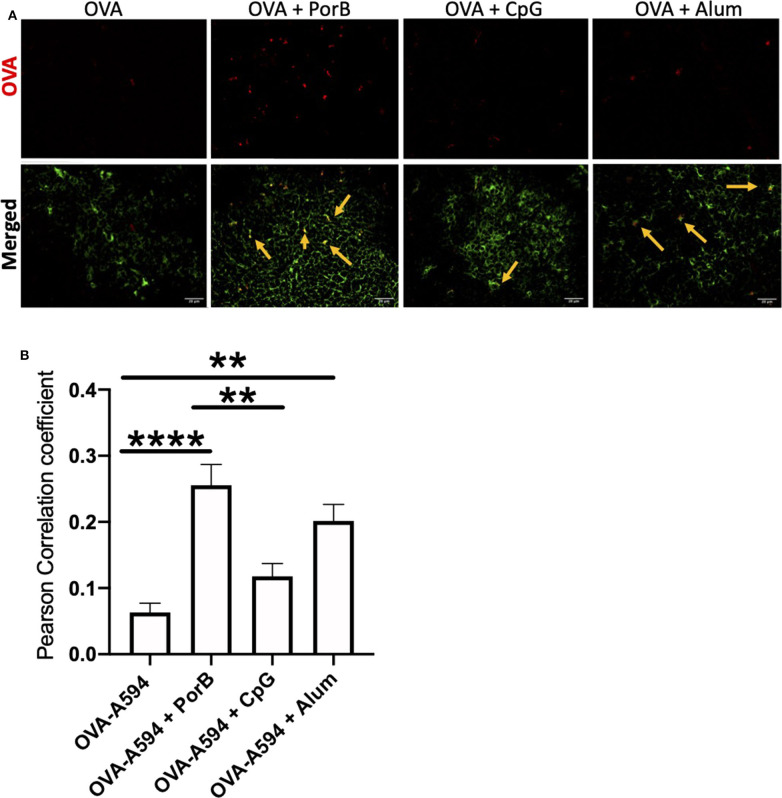
Figure 3.
Adjuvants effect colocalization of antigen onto FDCs. (A) Representative IHC images from draining lymph nodes from B6 control mice 24 h post subcutaneous injections. FDCs are shown in green. OVA-594, used as a non-immunogenic antigen, is shown in red. Areas of colocalization are shown with yellow arrows. Scale bar represents 20 μM. One out of 3 representative experiments is shown. Images were taken at 63x objective using a Leica SP5 microscope. (B) Quantification of Colocalization of fluorescently labeled OVA-A594 with FDCs within draining lymph nodes 24 h post subcutaneous injections. Colocalization was assessed using Pearson Correlation coefficients calculated with JaCoP plugin in ImageJ after background subtraction. n = 9–12, **p < 0.01, ****p < 0.001.

