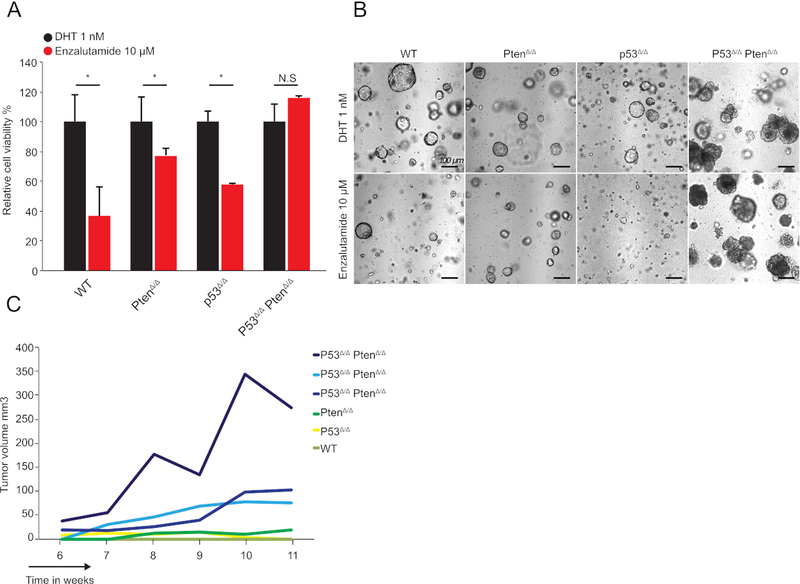
Figure 2: Assessing the pharmacological response of organoids derived from genetically engineered mice.
(A) Relative cell proliferation of murine WT, PtenΔ/Δ, P53Δ/Δ, and P53Δ/Δ PtenΔ/Δ organoids (y-axis, mean ± SD, measured by cell viability assay kit) of 2,500 cells 7 days post-establishment of organoids; (n = 3, *p < 0.05, t-test) with 1 nM DHT or 10 μM of second-generation antiandrogen as indicated. (B) Representative brightfield images of WT, PtenΔ/Δ, P53Δ/Δ, and P53Δ/Δ PtenΔ/Δ organoid cultures treated with 1 nM DHT or 10 μM second-generation anti-androgen as indicated. (C) Representative growth curve of WT, PtenΔ/Δ, P53Δ/Δ, and P53Δ/Δ PtenΔ/Δ organoids injected subcutaneously in the flank of isogenic C57/Bl6 mice. Only P53Δ/Δ PtenΔ/Δ organoids showed growth. A total of 1 × 10⁶ cells were injected. Three independent curves of P53Δ/Δ PtenΔ/Δ organoids are shown to show heterogeneity in growth speed.

