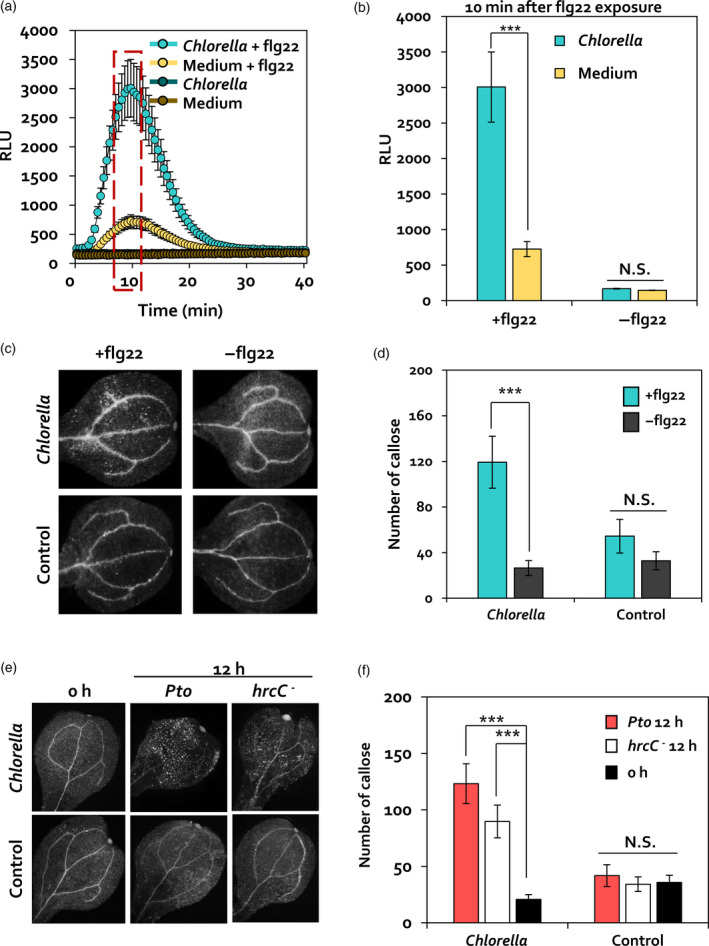
Figure 3.

Elicitation of PTI priming by C. fusca. (a, b) Measurement of ROS burst in leaves of 4‐week‐old C. fusca‐treated Arabidopsis plants upon flg22 (100 nm) treatment. ROS production, measured as relative light units (RLUs), was evaluated for 40 min after flg22 treatment. Maximum RLU signal was detected at 10 min after flg22 exposure. Data represent the mean ± SE of three independent biological replicates, each consisting of six leaf discs (n = 18). Asterisks indicate significant differences (*P < 0.05, **P < 0.001, ***P < 0.0001). Chlorella + flg22, Arabidopsis leaves pre‐treated with C. fusca and subsequently treated with 100 nm flg22; Medium + flg22, Arabidopsis leaves pre‐treated with BG11 medium and subsequently treated with 100 nm flg22; Chlorella, Arabidopsis leaves pre‐treated with C. fusca; Medium, Arabidopsis leaves pre‐treated with BG11 medium (c, d) Callose deposition in C. fusca‐treated (Chlorella) or BG11 medium‐treated (Control) Arabidopsis seedlings upon 100 nm flg22 treatment. Cotyledons were collected at 1 h after flg22 exposure for aniline blue staining. +flg22, 1 h after flg22 treatment; −flg22, before flg22 treatment. (e, f) Callose deposition in Chlorella‐treated (Chlorella) or BG11 medium‐treated (Control) Arabidopsis seedlings upon Pto DC3000 (OD600 = 1) or Pto DC3000 hrcC − (OD600 = 1) inoculation. Cotyledons were collected at 12 hpi for aniline blue staining. Wild‐type 12 h, 12 h after Pto DC3000 inoculation; hrcC − 12 h, 12 h after Pto DC3000 hrcC − inoculation; 0 h, before pathogen inoculation. Data represent mean and SE of three independent biological replicates (n = 15 replications per treatment). Asterisks indicate significant differences (*P < 0.05, **P < 0.01, ***P < 0.001).
