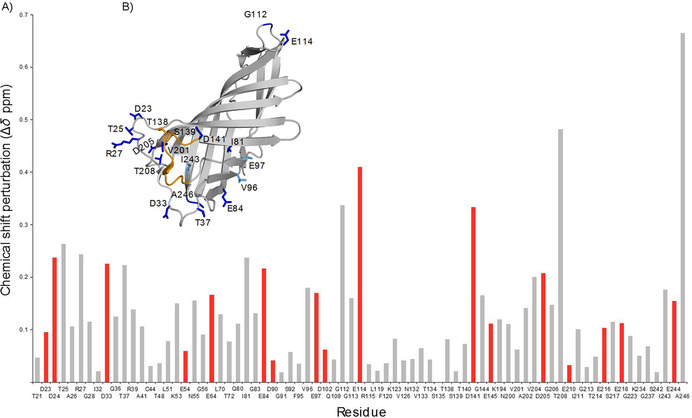
Figure 3.

CSP measurements by 2D 1H,15N correlation spectroscopy to monitor conformation changes in PsbO‐β. A) 15N,1H CSPs of all residues that could be evaluated (acidic residues are highlighted in red, CSPs were calculated by a formula provided in the Experimental Section. The residues N55, G56, and G223 were inserted as loop replacements during trimming of the long construct and are not part of the original PsbO sequence. B) Residues with strongest CSPs plotted on the crystal structure of PsbO‐β (PDB ID: 5G3925), color‐coded from high (≥0.2, dark blue) to intermediate values (0.17≤CSP≤0.2, light blue). Residues with small CSPs (<0.17) are not displayed; amino acids that are part of the cyano loop are shown in orange and those involved in PSII dimer contacts as sticks.
