
Figure 2.
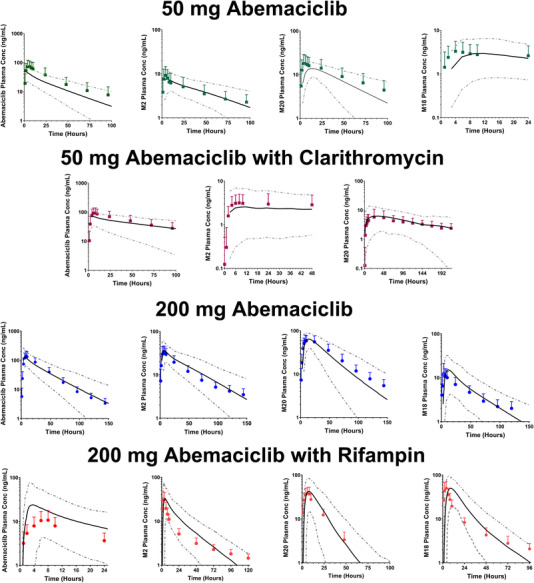
Observed and predicted plasma concentrations for bemaciclib and active metabolites after a 50‐mg dose of abemaciclib alone (green solid squares), a 50‐mg dose of abemaciclib coadministered with 500 mg twice a day clarithromycin (purple solid squares), a 200‐mg dose of abemaciclib alone (blue solid circles), and a 200‐mg dose of abemaciclib coadministered with 600 mg daily rifampin (red solid circles). The solid symbols represent the observed mean concentrations, and the error bars represent the observed SDs. The solid black lines represent the predicted mean concentrations; the dotted gray lines represent the 5th and 95th percentiles.