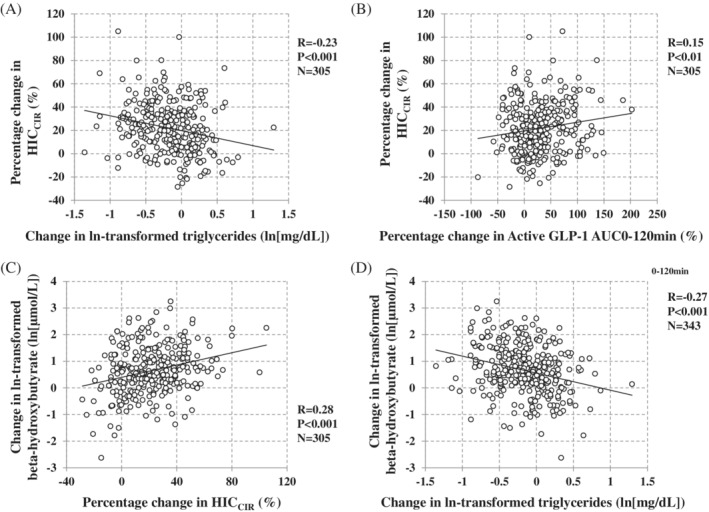
Figure 1.

Correlations between percentage change in HICCIR and variables and between ln‐β‐hydroxybutyrate and variables after 24 weeks of administration of tofogliflozin. A,B, Correlation between percentage change in HICCIR and change in ln‐transformed triglycerides and percentage change in active GLP‐1 AUC0‐120min by a meal tolerance test at week 24. C,D, Correlations between ln‐β‐hydroxybutyrate and HICCIR and change in ln‐transformed triglycerides. Correlation analysis was performed using Pearson correlation coefficient. HICCIR, C‐peptide AUC0‐120min/insulin AUC0‐120min ratio; GLP‐1, glucagon‐like peptide‐1
