Figure 2.

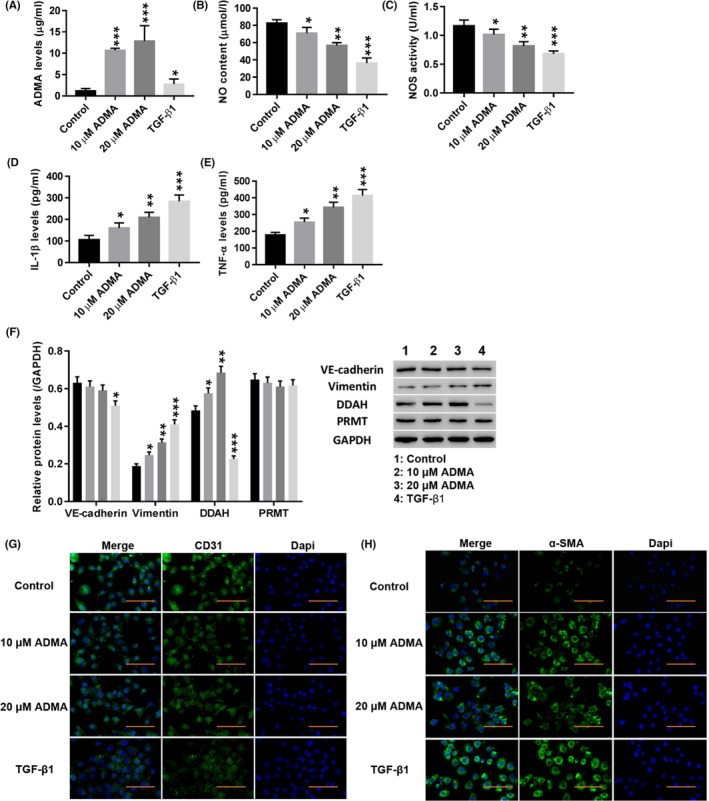
ADMA induced the EndMT in HUVECs. HUVECs were treated with TGF‐β1 (10 µg/L; AF‐100‐21C‐10; PeproTech) and ADMA (5, 10, 20 μmol/L; D4268; Sigma). A–E, The levels of ADMA (A), NO (B), NOS (C), IL‐1β (D) and TNF‐α (E) were detected. F, The protein levels of VE‐cadherin, vimentin, DDAH and PRMT were detected. G, H, Immunofluorescence detection of CD31 (G) and α‐SMA (H) at a magnification of 200×. *P < .05, **P < .01, and ***P < .001 vs Control. (F)  , Control;
  , 10 μmol/L ADMA;
  , 20 μmol/L ADMA;
  , TGF‐β1
