Figure 2.

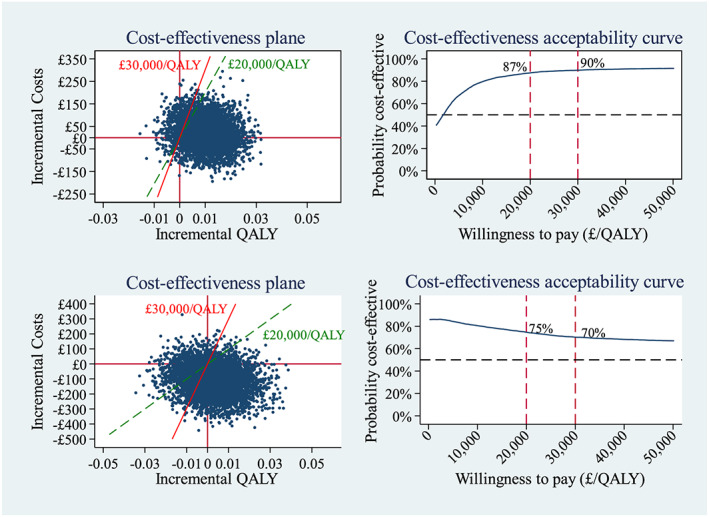
Cost‐effectiveness plane and cost‐effectiveness acceptability curve for the primary analysis (upper) and complete case analysis (lower), QALY=, quality‐adjusted life‐years [Colour figure can be viewed at wileyonlinelibrary.com]

Cost‐effectiveness plane and cost‐effectiveness acceptability curve for the primary analysis (upper) and complete case analysis (lower), QALY=, quality‐adjusted life‐years [Colour figure can be viewed at wileyonlinelibrary.com]