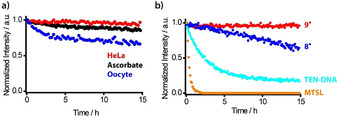
Figure 3.

a) Plot of the EPR intensities (double integral) vs. time for 200 μm 9. (red), 8. (blue), tetraethyl nitroxide S5 (cyan), and MTSL (orange) in a PBS buffer containing 4.75 mm sodium ascorbate, each corresponding to a 24‐fold molar excess of ascorbate. b) Plot of the EPR intensities (double integral) against time for 9. conjugated to YopO N624C (50 μm) in HeLa‐lysate (red), 4.75 mm ascorbate (black), and Xenopus laevis oocyte lysate (blue). The initial intensities were comparable, and the dead time was below 6 min in each case. Label S5 was conjugated to DNA to provide sufficient water solubility.
