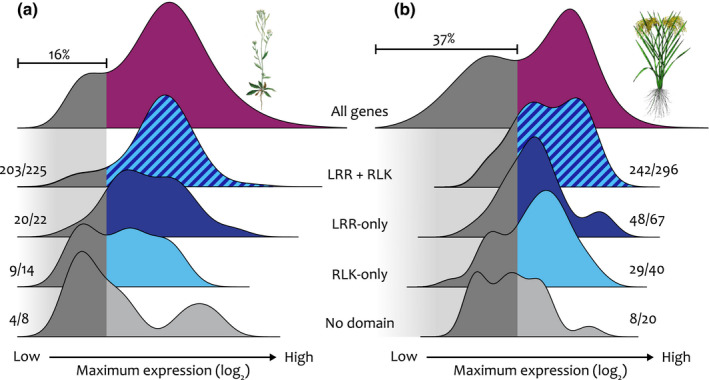
Figure 5.

Most structural variants are expressed at similar rates to validated gene models. (a) In Arabidopsis thaliana, the maximum expression density curve for all genes has a bimodal distribution, with 16% of all genes having lower maximum expression (dark gray) and the remainder with higher maximum expression (purple). (b) In rice, 37% of all genes have lower maximum expression. Canonical leucine‐rich repeat receptor‐like kinases (LRR‐RLKs) in both species (blue stripes) nearly all have higher maximum expression, as do most LRR‐only LRR‐RLKs (dark blue) and RLK‐only LRR‐RLKs (light blue). LRR‐RLKs without a detected LRR or RLK domain (light gray) are more likely to have lower maximum expression. Numbers to the side of density curves show the fraction of genes in the higher maximum expression range.
