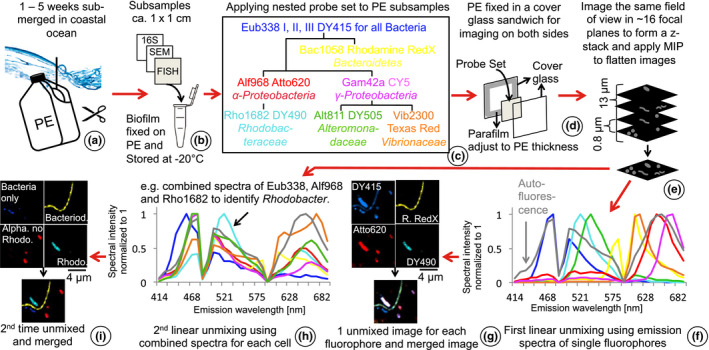
Figure 1.

Schematic set‐up of our experiment and workflow. (a) Polyethylene (PE) was submerged in surface seawater (~1‐m depth) for up to 5 weeks. (b) Triplicates were sampled each week for 16S rRNA amplicon sequencing, scanning electron microscopy (SEM) and CLASI (combinatorial laser and spectral imaging) – FISH (fluorescence in situ hybridization). (c) A nested probe set of nine different probes was developed based on the most abundant taxa on plastic marine debris (PMD) identified by amplicon sequencing (Amaral‐Zettler et al., 2015; De Tender et al., 2017). Each bacterial cell on PE hybridized with up to three different fluorescent probes. (d) To image both sides of PE pieces, we sandwiched PE pieces between two glass cover slips and imaged 10 different fields of view per side. (e) The uneven surface of the PE made it impossible to focus the entire biofilm in one field of view, so we performed z‐stack and maximum intensity projections (MIP) to bring the biofilm into one focal plane. (f) We further processed images by applying linear unmixing using emission spectra of each fluorophore. This resulted in separate images for each of the seven fluorophores and autofluorescence from phytoplankton and other autofluorescent cells. (g) Merging these false‐coloured images caused a colour mix that hampered clear identification of different taxa because overlaying three colours per cell resulted in whitish cells. Combined emission spectra of up to three different fluorophores were retrieved from images from the first linear unmixing process. (h) The second linear unmixing was applied to the same unprocessed images used for the first linear unmixing. (i) The second unmixing produced images showing single colours also for double‐ and triple‐labelled cells. Colour‐codes in the first and second linear unmixing plots refer to the different fluorophores and taxa shown in the nested probe set in the tree diagram, respectively
