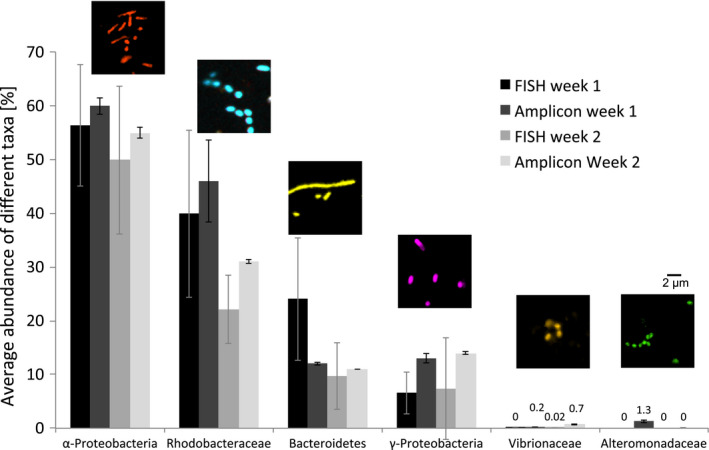
Figure 6.

Relative average abundance of different taxa ascertained from cell counting of micrographs (mean of 20 images per sample ± SD) from CLASI‐FISH experiments and from 16S rRNA amplicon sequencing data of the same samples. Each week we sampled three replicates for amplicon sequencing but only one sample for CLASI‐FISH (error bars indicate the variations within the biofilm of each sample: for sequencing, variation between three replicate pieces of plastic; for imaging, variation between 20 fields of view from a single piece of plastic). Epifluourescence microscope images above bars show examples of taxon‐specific cells. Filamentous Bacteroidetes were segmented into individual cells with fiji software before counting. Colour coding of the cells is as in Figure 3. Note that Rhodobacteraceae are included within the Alphaprotobaceria and Vibrionaceae and Alteromonadaceae are included within the Gammaprotobacteria
