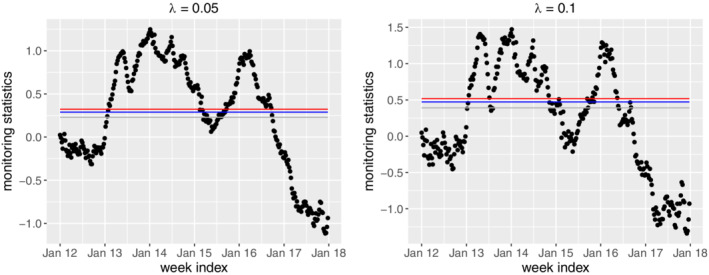
Figure 6.

The exponentially weighted moving average control charts under different combinations of ARL0 and λ. The grey, blue and red lines respectively denote the ARL0 values of 52, 104, and 156 [Colour figure can be viewed at wileyonlinelibrary.com]
