Figure 10.

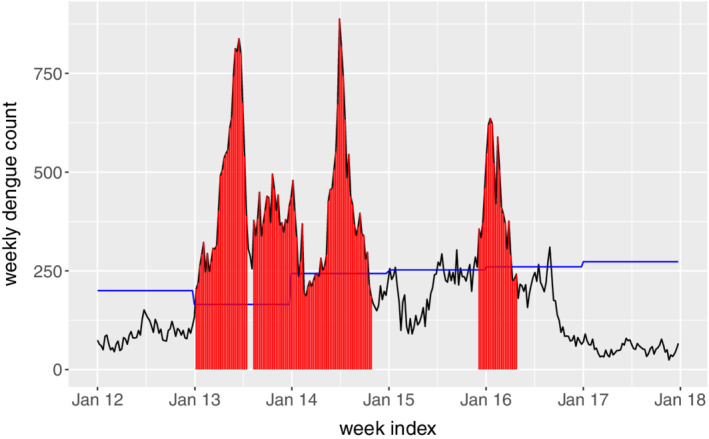
Outbreak signals during 2012 to 2017 given by the cumulative sum control charts. The blue line denotes the threshold determined by Ministry of Health [Colour figure can be viewed at wileyonlinelibrary.com]

Outbreak signals during 2012 to 2017 given by the cumulative sum control charts. The blue line denotes the threshold determined by Ministry of Health [Colour figure can be viewed at wileyonlinelibrary.com]