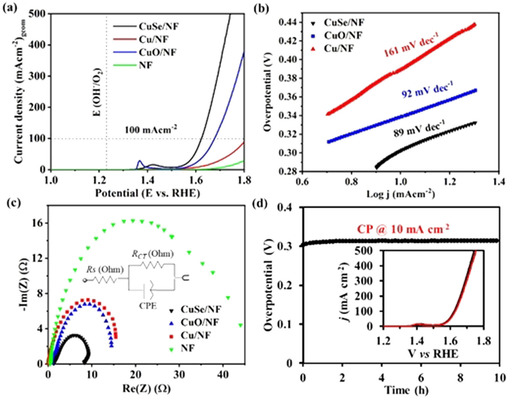
Figure 2.

Electrochemical study of CuSe, CuO, and Cu on NF. (a) Polarization curves from LSV for OER, (b) Tafel plot, (c) Nyquist plot from EIS analysis, and (d) the chronopotentiometry (CP) measurements at a current density of 10 mA cm−2 (OER) for 10 h. (d, inset) LSV measured before (black) and after 10 h of CP (OER) experiment (red), exhibiting almost overlapped polarization curves demonstrating the remarkable stability of CuSe. The LSV and Tafel slopes were recorded at a scan rate of 1 mV s−1.
