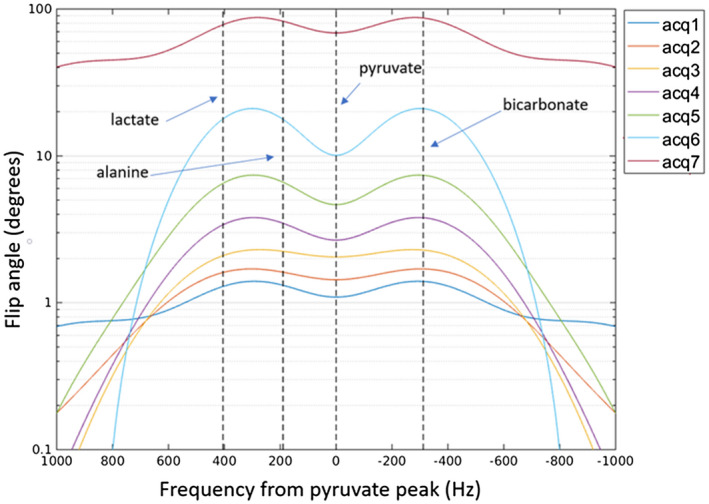
Figure 2.

Double Gaussian RF spectral profile used in each msVFA acquisition, centered on the pyruvate peak. The resonant frequency of each metabolite is indicated by vertical dashed lines. The magnitude and shape of the RF profile progressively changes with each acquisition to follow the msVFA trajectory
