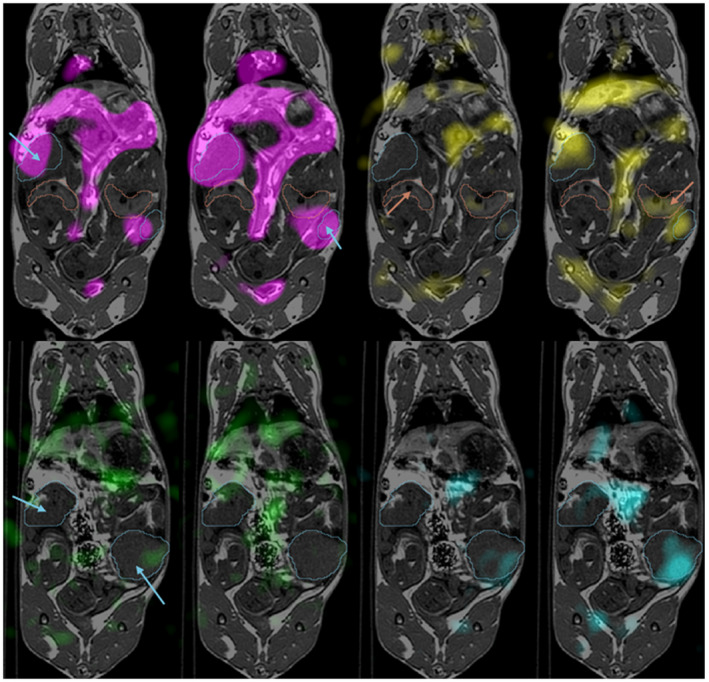
Figure 4.

Typical hyperpolarized 13C metabolite images overlaid on axial T1 of the same animal at 30 seconds after injection. Four pairs of images are shown here for each metabolite: magenta, pyruvate (top left); yellow, lactate (top right); green, alanine (bottom left); and cyan, bicarbonate (bottom right). For each pair of images, the image on the left was acquired using CFA and the image on the right acquired using msVFA. The image pairs have identical window and level for each metabolite. Placentae are indicated by blue arrows and outline, and fetal livers are indicated by red arrows and outline. A different slice is shown for alanine and bicarbonate, to show increased bicarbonate signal in the placenta using msVFA
