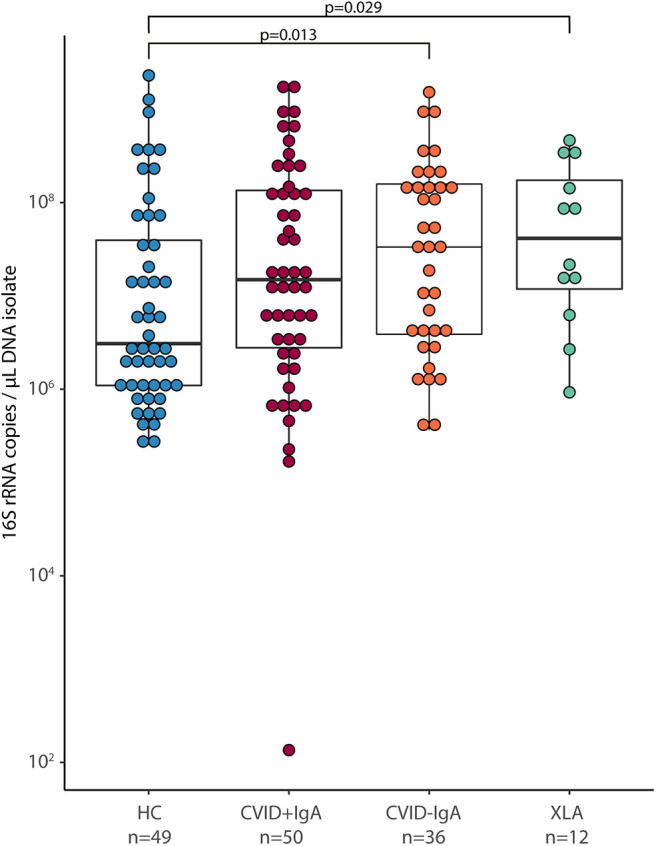
Figure 1.

Bacterial load in oropharyngeal swab samples as determined by qPCR for copies of the 16S rRNA gene in DNA isolates from oropharyngeal swabs in healthy controls (HC, n = 49), CVID + IgA (n = 50), CVID –IgA (n = 36), and X-linked agammaglobulinemia (XLA, n = 12). The horizontal line inside the box represents the median. The whiskers represent the lowest and highest values within 1.5 × interquartile range. Statistical test: Mann-Whitney U test.
