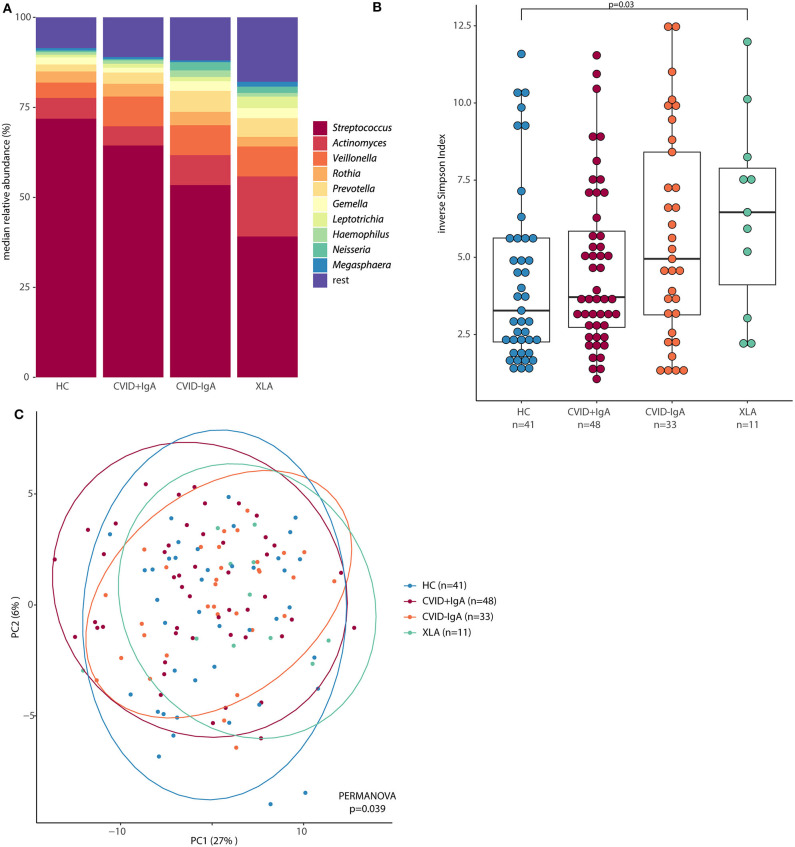
Figure 2.
(A) Median relative abundance of top 10 most abundant genera determined by 16S rRNA sequencing of healthy controls (HC, n = 41), CVID +IgA (n = 48), CVID -IgA (n = 33), and XLA (n = 11). (B) Alpha diversity of the same samples described in (A) as measured by inverse Simpson's index on 16S rRNA sequencing data. The horizontal line inside the box represents the median. The whiskers represent the lowest and highest values within 1.5 × interquartile range. Statistical test: Mann-Whitney U test. (C) Principal component analysis of centered log ratio (CLR)-transformed family level 16S rRNA sequencing data of the same samples described in (A). Ellipses indicate 95% confidence intervals. PERMANOVA using Euclidean distance on CLR data.

