
Figure 1.
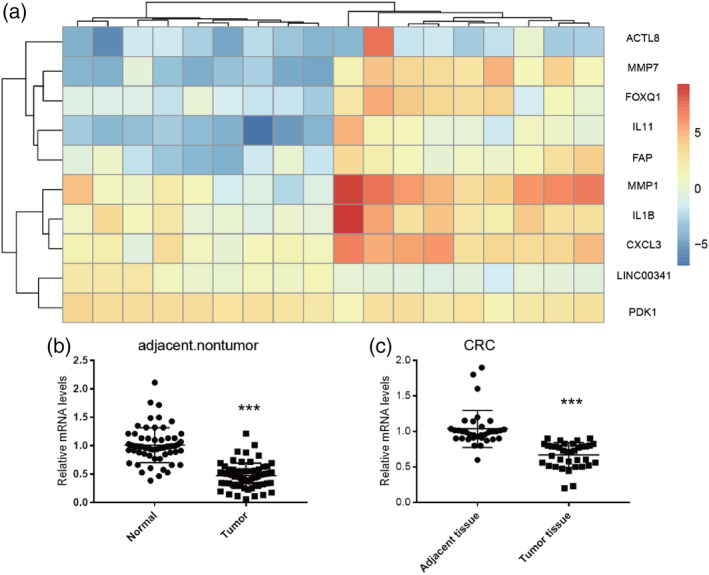
Differential expression of LINC00341 in colorectal cancer. A, Heat map and hierarchical clustering (log2 fold change and q value <0.05) are presented to show the variation in lncRNAs between paired colorectal cancer and adjacent nontumor colorectal tissues. Red indicates high expression, and green indicates low relative expression. B, LINC00341 expression in normal samples and CRC samples was measured by qRT‐PCR. C, LINC00341 expression in 36 paired with colorectal carcinoma tissues was determined using real‐time PCR assays, compared with the adjacent tissues. LINC00341 expression level was normalized to GAPDH. Results are shown as means ± SD by two‐tailed Student's t test. *P<0.01. **P<0.001. ***P<0.0001