
Figure 2.
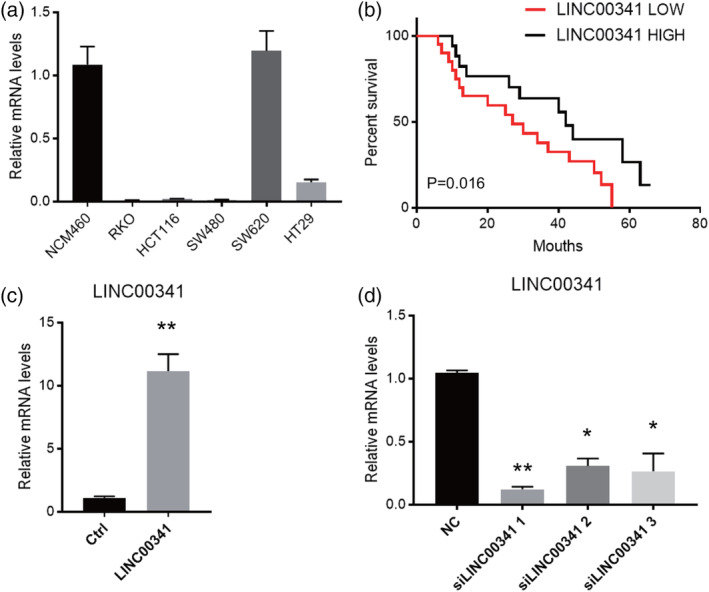
Gain and loss function in vitro of LINC00341. A, Expression levels of LINC00341 in five CRC cell lines. NCM460 was invoked as a normal control. Data are shown as means ± SD. Data are representative of three independent experiments. B, Kaplan‐Meier overall survival curves for 20 patients with BC classified according to relative LINC00341 expression level. C, Overexpression of LINC00341 in cultured HCT116. The LINC00341 bar represents the level of the lncRNA in the cells transfected with a LINC00341‐overexpressing lentivirus, while NC represents the level of the lncRNA in the cells transfected with a negative‐control lentivirus. D, SW620 cells were transfected with three siRNA for LINC00341 to knock down LINC00341 expression. LINC00341 expression level was normalized to GAPDH. Results are shown as means ± SD by two‐tailed Student's t test. *P < .001. **P < .01. ***P < .001