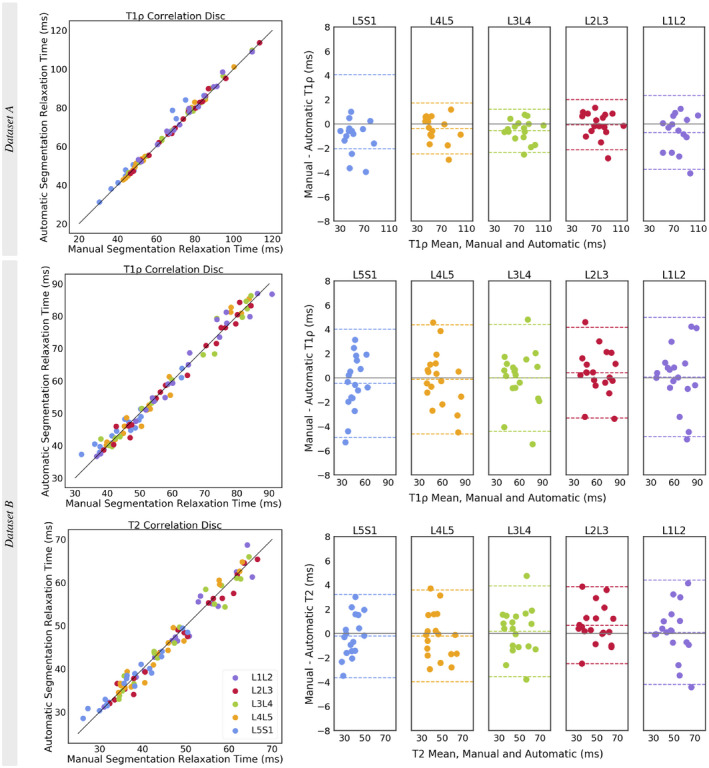
Figure 3.

Correlation scatterplot for all discs and Bland‐Altman plots with the 95% limits of agreement (LOAs) for each disc level for comparison of manually and automatically extracted T1ρ and T2 relaxation times. In data set A’s L5S1 T1ρ Bland‐Altman plot, the lower LOA at −8.16 ms was omitted to maintain the same y‐axis range between plots. Biomarker results for data set A are from a single T1ρ map slice (2D), whereas results from data set B are from a stack of T1ρ and T2 map slices (3D)
