
Figure 2.
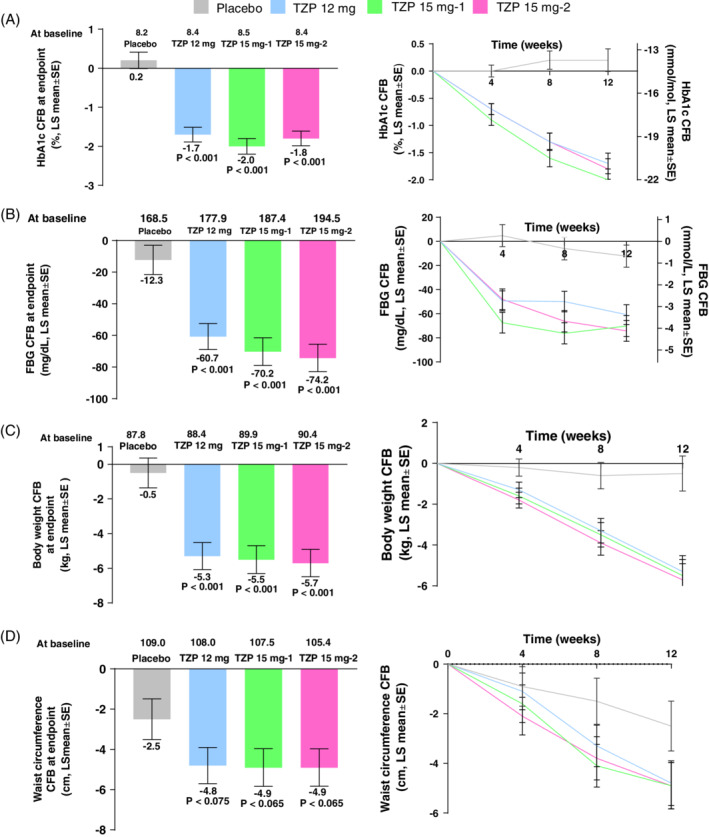
Efficacy outcomes of treatment with tirzepatide at 12 weeks treatment: (A) HbA1c (%); (B) fasting blood glucose (FBG); (C) body weight; (D) waist circumference. CFB, change from baseline; LS, least squares; mITT, modified intent‐to‐treat; MMRM, mixed effect model repeat measurement; SE, standard error; TZP, tirzepatide; mITT population, MMRM on treatment analysis; P‐values versus placebo