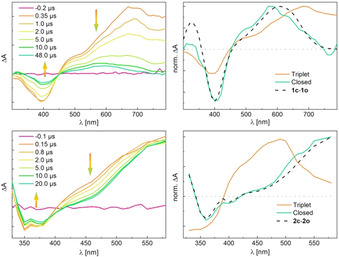
Figure 3.

Transient absorption difference spectra upon nanosecond laser pulse excitation (λ max=355 nm) for selected times under degassed conditions of 1 o (top left) and 2 o (bottom left); evolution associated difference spectra of the triplet excited states and closed forms 1 c (top right) and 2 c (bottom right) obtained from a sequential model as well as the difference spectra of closed and open forms obtained from stationary experiments (dashed lines). Zero‐absorbance lines are given as dotted lines.
