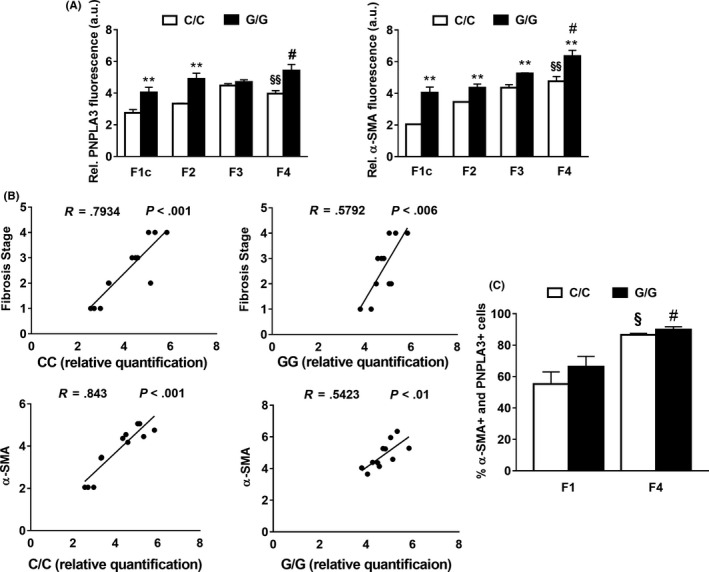
Figure 2.

PNPLA3 correlates significantly with the pro‐fibrogenic marker α‐SMA and with the fibrosis stage in NASH patients. A, Quantitative relative fluorescence amount for PNPLA3 (red) and α‐SMA (green) calculated from pictures (randomly chosen as n = 6 per liver slide) using ImageJ software and obtained from human liver biopsies, carrying the WT PNPLA3 with different fibrosis stage (F1‐F2‐F3‐F4; a.u. = arbitral units). **P < .01 F1c C/C vs G/G; §P < .05 F1c C/C vs F4 C/C; §§ P < .01 F1c C/C vs F4 C/C; #P < .05 F4 C/C vs G/G. B, Correlation between PNPLA3 relative quantification and fibrosis stage(R = 0.579, P = .006) with PNPLA3 in both PNPLA3 genotypes. Correlation between PNPLA3 and α‐SMA tissue relative quantification. (C/C: R = 0.843, P < .001; G/G: R = 0.5423, P < .01). Data shown as mean values ± SD. C, Colocalization expressed as hepatic cells percentage positive for both PNPLA3 and α‐SMA (% of cells positive for PNPLA3 and α‐SMA), during progression of liver fibrosis from F1 to F4, in C/C and G/G carriers. Analysis performed using ImageJ software (n = 4 each fibrosis stage and PNPLA3 genotype). §P < .05 F1c C/C vs F4 C/C; #P < .05 F4 C/C vs F4 G/G. Data shown as mean values ± SD. White bars stay for C/C PNPLA3 and black bars stay for G/G PNPLA3 throughout the figure panels. F1c = peri‐portal sinusoidal fibrosis; F2 = Zone 3 sinusoidal fibrosis and peri‐portal sinusoidal fibrosis; F3 = Bridging fibrosis; F4 = Cirrhosis24
