
Figure 3.
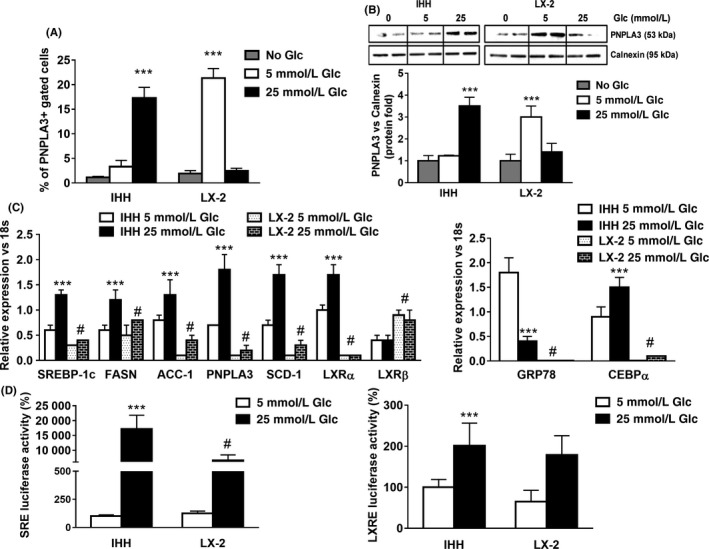
High glucose (25 mmol/L) induces PNPLA3 and de‐novo lipogenic genes expression in hepatocytes, but not in HSC. LX‐2 and IHH cells were cultured in medium without glucose (No Glc, grey bars) or in medium containing low (5 mmol/L, white bars) or high (25 mmol/L, black bars) glucose (Glc) for 24 h. A, PNPLA3 intracellular staining was analyzed by flow cytometry. Data displayed as percentage (%) of gated PNPLA3 positive cells. ***P < .001 vs No Glc (grey bars). B, Representative blots of protein extracts collected from IHH and LX‐2. Depicted protein expression of PNPLA3 was calculated using ImageJ software. Calnexin was used as a loading control. ***P < .001 vs No Glc. C, Expression of SREBP‐1c, FASN, ACC‐1, PNPLA3, GRP78, CEBPα, SCD‐1, LXRα and β from IHH and LX‐2 cells analyzed by real‐time PCR. Data normalized to 18s. ***P < .001 vs IHH 5 mmol/L Glc, #P < .001 vs IHH 25 mmol/L Glc. D, Luciferase activity of IHH and LX‐2 cells transiently transfected with either SREBP‐1c response element (SRE) plasmids or LXR response element (LXRE). All data displayed represents three independent experiments performed in duplicates. Data shown as mean values ± SD. ***P < .001 vs IHH 5 mmol/L Glc, #P < .001 vs IHH 25 mmol/L Glc