
Figure 4.
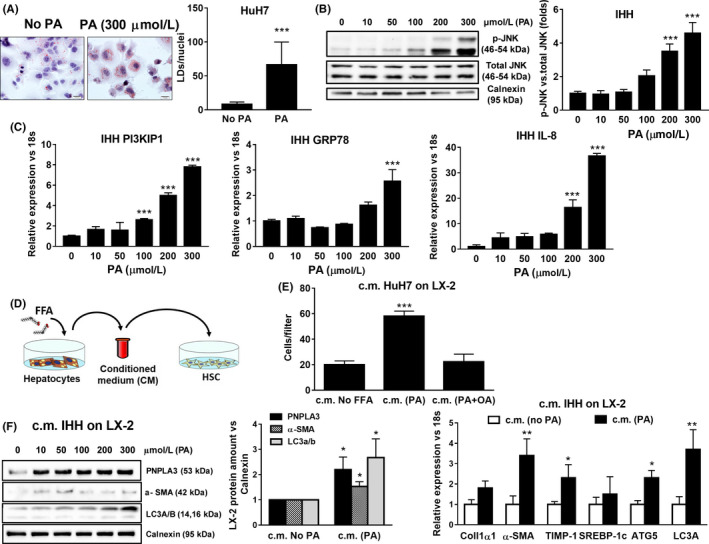
Conditioned medium (c.m.) form lipid stressed hepatocytes induced migration, PNPLA3, pro‐fibrogenic and autophagic markers expression in HSCs. Hepatoma cell lines (HuH7) and immortalized human hepatocytes (IHH) were cultivated without (No PA) or with 300 μmol/L of palmitic acid (PA) for 24 h to induce lipid accumulation and cellular stress. A, Oil Red O staining was performed on fixed HuH7 cells after 300 μmol/L PA treatment, as described in Materials and Methods. Lipid droplets (LDs) amount was calculated using BioPix iQ Imaging Software and normalized on the number of nuclei (LDs/nuclei). ***P < .001 vs No PA. B, Representative blots of phospho‐JNK (p‐JNK) performed on protein extracts collected from IHH cells. Densitometry analysis calculated using ImageJ software and data normalized to total JNK. ***P < .001 vs IHH without PA. C, Expression of PI3KIP1, GRP78 and IL‐8 in IHH analyzed by real‐time PCR and normalized to 18s. Data displayed represents three independent experiments performed in duplicates. ***P < .001 vs IHH without PA. D, Schematic representation of conditioned medium (c.m.) collected from hepatocytes (IHH and HuH7) cultivated for 24 h without FFA (c.m. No FFA) or with different concentrations of PA (up to 300 μmol/L) or in combination with oleic acid (OA; ratio 1:2) and then used to stimulate untreated HSCs, for additional 24 h. E, Migration was evaluated in LX‐2 using modified Boyden chambers for 6 h, after exposure to c.m. from lipid‐laden HuH7 cells treated as indicated in bar graph. Data are presented as number of cells per filter migrated towards the lower chamber. Data shown are representative of three independent migration assays. ***P < .001 vs c.m. HuH7 no FFA. (F, left panel) C.m. collected from IHH cultivated for 24 h without PA (c.m. No PA) or with PA at different concentrations and then used to stimulate LX‐2 for 24 h. Depicted PNPLA3, α‐SMA, LC3 A/B protein expression was analyzed by western blotting and data normalized to Calnexin. *P < .05 vs c.m. No FFA. (F, right panel) Expression of Collagen 1α1, α‐SMA, TIMP‐1, SREBP‐1c, ATG5 and LC3a analyzed by real‐time PCR and normalized to 18 s. Data displayed represents three independent experiments performed in duplicates. Data shown as mean values ± SD. *P < .05 and **P < .01 vs c.m. No PA