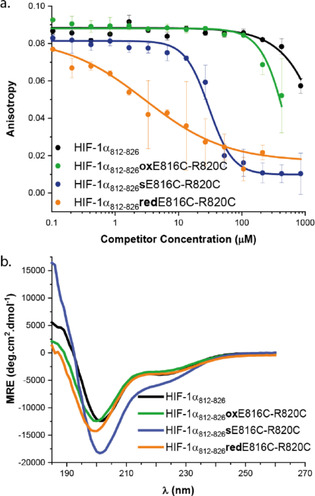
Figure 2.

Biophysical characterization a) FA data for the E816‐R820 peptide series, FITC‐Ahx‐HIF‐1α786–826 tracer (25 nm) p300 (100 nm) 20 mm Tris, 100 mm NaCl 0.1 mm DTT, pH 7.46. b) CD spectra for wt‐HIF‐1α812–826, HIF‐1α812–826 sE816C‐R820C, HIF1α812–826 oxE816C‐R820C and HIF‐1α812–826 redE816C‐R820C (250 μm concentration, 20 mm sodium phosphate, pH 7.55).
