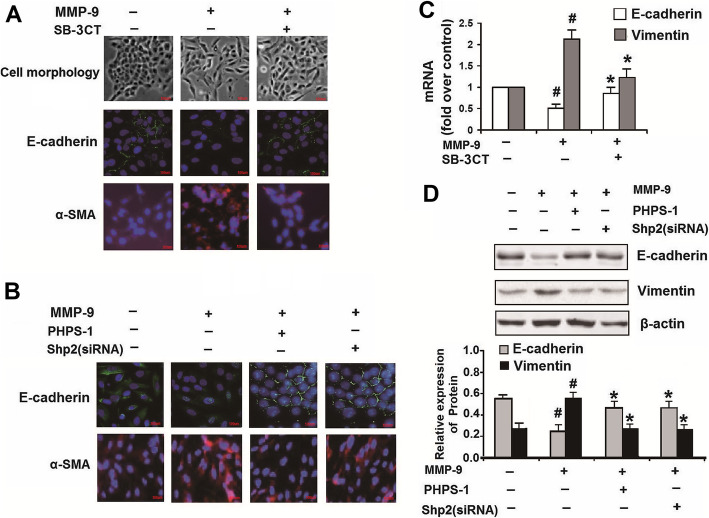
Fig. 6.
MMP-9 inhibition, Shp2 inhibition or Shp2 knockdown suppresses the expression of EMT-related factors induced by recombinant MMP-9 in NCI-H292 cells. a NCI-H292 cells with no treatment exhibit a pebble-like shape and display cell-cell contacts consistent with an epithelial morphology. The cells treated with human recombinant MMP-9 (2 μg/ml, 48 h) exhibit a fibroblast-like morphology with cellular elongation and reduction of cell-cell contacts. SB-3CT (1 μM) prevents the MMP-9-induced cellular changes and preserves normal epithelial morphology. The cells treated with recombinant MMP-9 for 48 h exhibit weaker expression of E-cadherin and stronger expression of α-SMA, compared with control. MMP-9 inhibition by SB-3CT (1 μM) alleviates the recombinant MMP-9 induced changes of E-cadherin and α-SMA expression. Scale bar = 100 μm. b Pharmacological inhibition or Shp2 knock down reverses the recombinant MMP-9 induced changes of E-cadherin and α-SMA expression. Scale bar = 100 μm. c MMP-9 inhibition by SB-3CT (1 μM) prevents the recombinant MMP-9 (2 μg/ml) induced decreases in E-cadherin expression and increases in α-SMA mRNA expression assessed by real-time PCR. n = 3 per group. #p < 0.05 compared with control (no treatment); *p < 0.05 compared with cells treated with recombinant MMP-9. d Shp2 inhibition by PHPS1 (10 μM) or knock down by siRNA prevents the recombinant MMP-9 (2 μg/ml) induced decreases in E-cadherin expression and increases in α-SMA protein expression assessed by western blot. Data are expressed as mean ± SEM of three independent experiments. n = 3 per group. #p < 0.05 compared with control (no treatment); *p < 0.05 compared with cells treated with recombinant MMP-9. At least three independent experiments were completed for each group assessment. Data are presented as the mean ± SEM. Statistical significance is determined by one-way ANOVA followed by the Student-Newman-Keuls test

