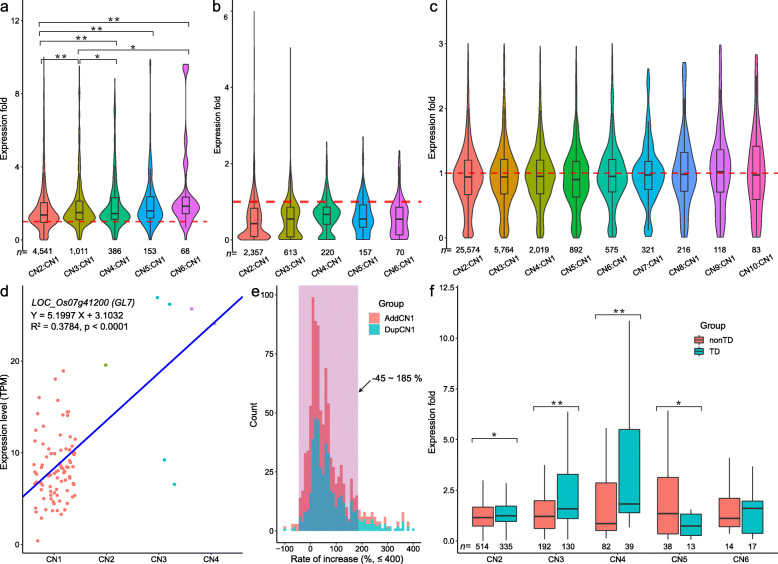
Fig. 2.
The impact of copy number variation on gene expression. a–c The distributions of expression folds (duplications to normal copy number) of the positively correlated genes (a), negatively correlated genes (b), and non-significantly correlated genes (c). CN1 means that its copy number is equal to 1 and so on. * and ** indicate significant difference at P < 0.05 and P < 0.01, respectively, determined by the Tukey HSD test in R. The outliers (out of μ ± 3σ) are not displayed. d The correlation between copy number and expression level of the GL7 (LOC_Os07g41200), and a TPM outlier from the CN1 group was discarded. The fitting and significance test of linear equation were performed by “trendline” function from the “basicTrendline” package in R. e The distributions of the increase rate of the two statistics of the positively correlated genes: AddCN1 (add one copy at a time) and DupCN1 (duplication compared to normal copy number). Values greater than 400% are not included in the figure. The data in the pink-shaded area accounted for more than 80% of each group. f The different effects of tandem duplications (TD) and non-tandem duplications (nonTD) on gene expression level. * and ** indicate significant difference at P< 0.05 and P < 0.01, respectively, determined by the Wilcoxon test in R. The outliers (out of μ ± 3σ) are not displayed

