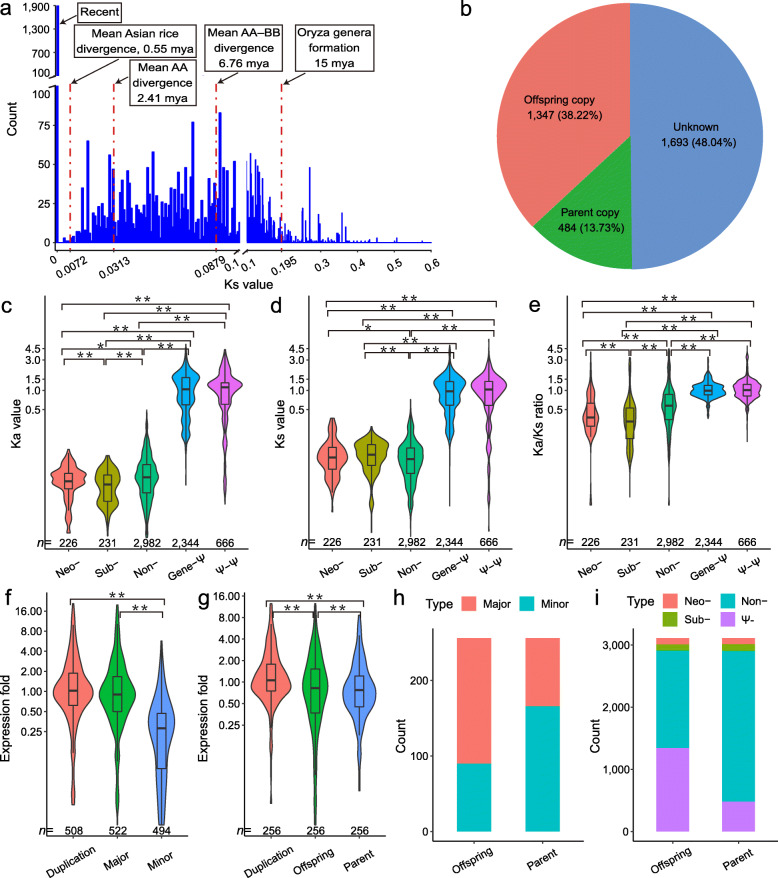
Fig. 3.
The expression and evolution of duplicated genes. a The Ks distribution of non-pseudogenetic duplicate pairs. The four Ks values (red dotted lines marked) represent key evolutionary events in the evolution of the Oryza genera, respectively, referring in the Stein et al. (2018). “Recent” means their Ks values are 0. b The component of the pseudogene copies. About half of the pseudogene copies were indistinguishable. And the rest was dominated by offspring copies. c–e The difference on Ka (c), Ks (d), Ka/Ks (e) and among neo-functionalized (Neo-), subfunctionalized (Sub-), undifferentiated (Non-) duplicated genes, functional gene-pseudogene pairs (Gene-Ψ), and pseudogene-pseudogene pairs (Ψ-Ψ). * and ** indicate significant difference at P < 0.05 and P < 0.01, respectively, determined by the Wilcoxon test in R. The outliers (out of μ ± 3σ) are not displayed. f, g The dosage sharing of major/minor (f) and parent/offspring (g) copies. The expression fold was normalized to the average TPM values of its corresponding normal gene (CN = 1). ** indicates a significant difference at P < 0.01 determined by the Tukey HSD test in R. The outliers (out of μ ± 3σ) are not displayed. h, i The proportions of major/minor copy (h) or differentiated copies (i) between parent and offspring copies

