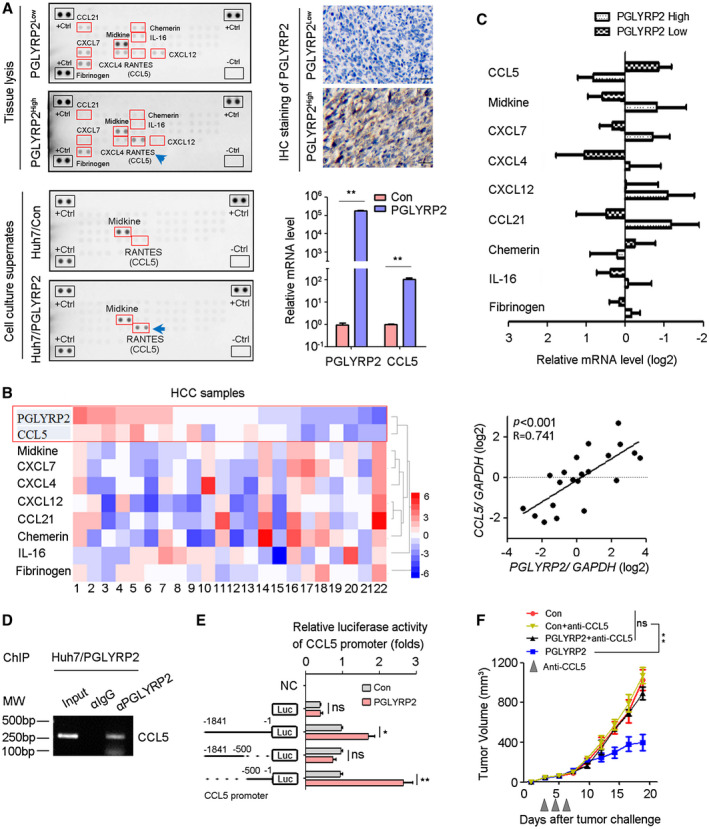
Figure 6.

PGLYRP2 promotes chemokine CCL5 expression in HCC. (A) Chemokine levels in HCC tissue lysate and supernatants of Huh7 cells were detected using a human chemokine protein array. The PGLYRP2 expression level in HCC tissues was measured by IHC. Scale bars, 100 μm. Expression levels of PGLYRP2 and CCL5 in Huh7/Con and Huh7/PGLYRP2 cells were detected by real‐time PCR. (B,C) Expression of PGLYRP2 and chemokine was detected in 19 HCC samples using a quantitative RT‐PCR assay. Heat map showed different expression of chemokines in 19 HCC tissues (B, left panel). The association between PGLYRP2 and CCL5 level in HCC samples was analyzed (B, right panel). The mRNA levels of chemokines were analyzed in the high–PGLYRP2 expression and low–PGLYRP2 expression groups (C). (D) The binding activity of PGLYRP2 to the CCL5 promoter was assessed by ChIP assay in Huh7/PGLYRP2 cells. (E) Relative luciferase activity in Huh7/Con and Huh7/PGLYRP2 cells transfected with plasmids of pGL4 vector, PGLYRP2 promoter (–1841 to –1 bp) luciferase reporter, PGLYRP2 promoter (–1841 to –500 bp) luciferase reporter, or PGLYRP2 promoter (–500 to –1 bp) luciferase reporter alone. (F) Tumor volume of Hepa 1‐6/control or Hepa 1‐6/PGLYRP2 tumors in immunocompetent BALB/c mice and anti‐CCL5‐treated BALB/c mice. Mice that did not receive anti‐CCL5 treatment were treated with an equivalent concentration of immunoglobulin G isotype control antibody. All results are reported as mean ± SEM. *P < 0.05, **P < 0.001. Abbreviations: Ctrl, control; IgG, immunoglobulin G; Luc, luciferase; MW, molecular weight; NC, negative control; ns, not significant; RANTES, regulated upon activation, normal T cell expressed, and secreted.
