Figure 3.

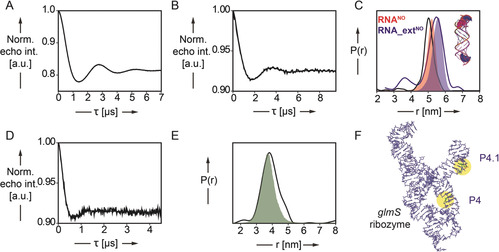
PELDOR‐derived distance distributions in spin‐labeled RNA duplexes RNANO and RNA_extNO and in the 185‐nucleotide‐long glmS ribozyme. A,B) Background corrected PELDOR time traces of RNANO (A, 16.7 μm RNA) and RNA_extNO (B, 15.0 μm) C) Inter‐label distance distributions of RNA duplexes RNANO (red curve) and RNA_extNO (blue curve) overlaid with predicted N‐N (nitroxyl) distance distributions (red and blue shading) by MD simulation. D) Background corrected PELDOR time traces of glmSNO4_4.1 (30 μm). E) Inter‐label distance distributions of glmS ribozyme construct glmSNO4_4.1 (green curve) overlaid with predicted N–N (nitroxyl) distance distributions (green shading) by MD simulation. F) Representative snapshot (cluster analysis) of glmSNO4_4.1. The two‐spin‐labeled TPT3NO residues in helix P4 and P4.1 are colored in green and highlighted in yellow.
