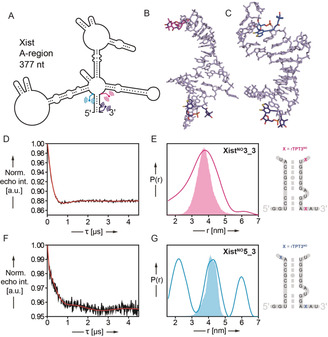
Figure 4.

PELDOR‐derived distance distributions in the spin‐labeled A‐region of the long non‐coding RNA Xist (377 nt). A) Schematic of the 377 nt Xist A‐region prepared and site‐specifically modified by TPT3NO in this work based on the folding model of Fang et al.17a The positions of the spin label pairs in two Xist constructs XistNO3_3 and XistNO5_3 are indicated in pink and dark blue (XistNO3_3) or blue and dark blue (XistNO5_3). B,C) Representative snapshots (cluster analysis) of 1 μs MD simulation of the RNA duplexes shown in (E) and (G) (right panel) respectively. D,F) Background corrected PELDOR time traces of 377 nt RNAs XistNO3_3 (D, 7.5 μm RNA) and XistNO5_3 (F, 7.2 μm RNA). E,G) Inter‐label distance distributions of RNAs XistNO3_3 (pink curve, E) and XistNO5 3 (blue curve, G) overlaid with predicted N–N distance distributions (XistNO3_3: pink shading, G and XistNO5_3: blue shading, G) by MD simulation.
