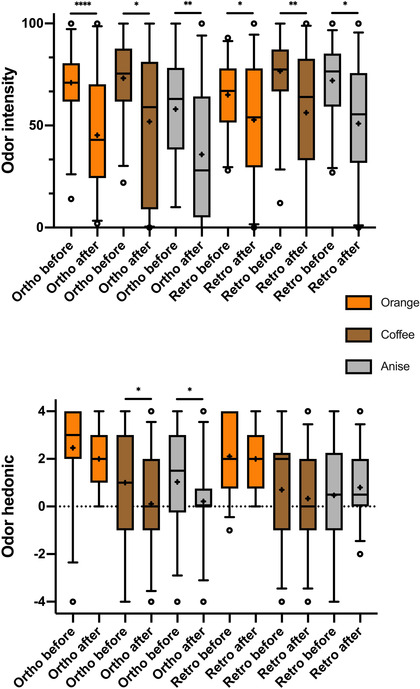
FIGURE 3.

Box‐and‐whisker plots of hedonic and intensity ratings of orthonasally and retronasally presented odors before and after foam application. Odor hedonic: –4 = very unpleasant to 4 = very pleasant; odor intensity: 0 = nothing to 100 = very intense; medians (Q0.5; line), interquartile range (Q0.25, Q0.75; boxes); + indicating the mean scores. *p < 0.05, **p < 0.01, ****p < 0.0001.
