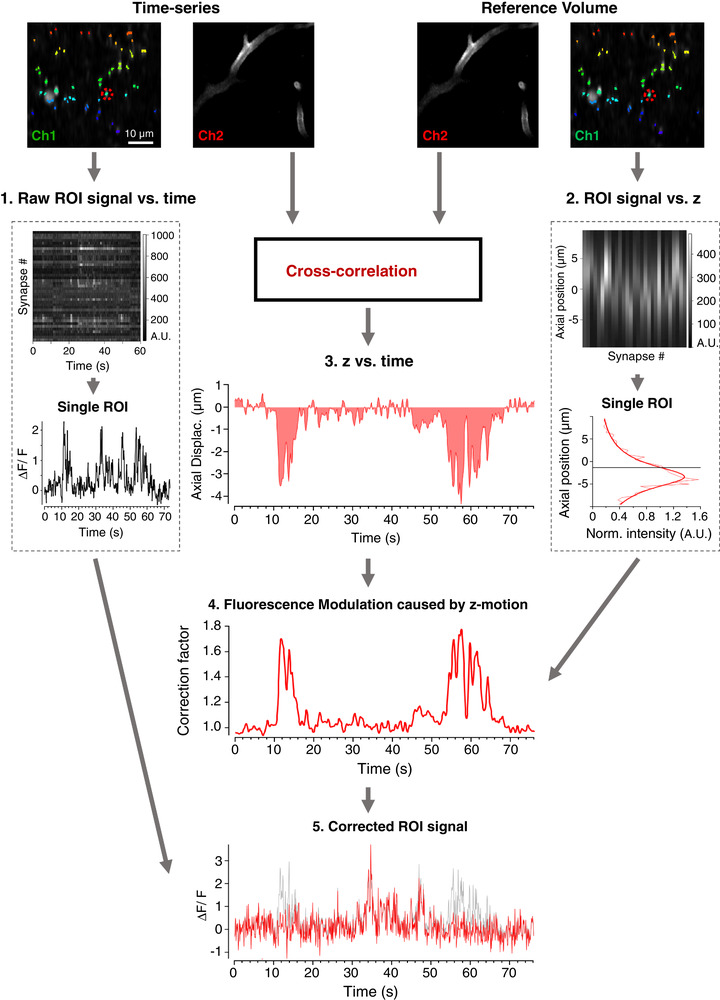
Figure 1. Workflow for correction of z‐motion artefacts when imaging synaptic activity in vivo .

A two‐channel time‐series (top left) and reference volume (top right) is acquired; SyGCaMP6f, green channel (Ch1); blood vessel marker, red channel (Ch2). An ROI mask is generated and applied to Chl of the time‐series (coloured pixels). The raw signal over time is collected for all ROIs. This relation is shown in box 1, where the upper panel shows each ROI represented as a row and the bottom panel shows an example of an individual trace. The same ROIs are identified in the reference volume, providing a function relating ROI intensity with z‐position (box 2). The continuous line describing these measurements is a Moffat Function (eqn (1)) with α = 3.83 and β = 1.33. The axial position as a function of time (relation 3) is estimated by cross‐correlation between each frame in the time‐series and a reference volume in Ch2. Relations 2 and 3 are then used to calculate a correction vector (relation 4) that estimates the relative change in fluorescence caused by z‐motion through the time‐series. The signal from each ROI can then be divided by its own correction vector to obtain an estimate of signal independent of z‐position (relation 5, original signal in grey, corrected in red).
