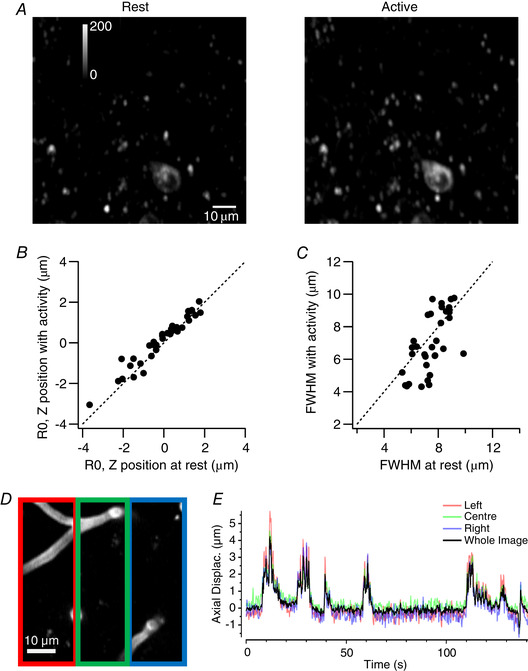
Figure 6. Estimates of axial intensity profiles with and without ongoing activity.

A, a comparison of the same field of view of SyGCaMP6f in VIP interneurons at rest (left), when activity was low, and during locomotion (right), when activity was high. Each image is a maximum intensity projection of 8 planes spanning ± 2 µm from the central plane. B, a plot of the central position of the RSF (R0) estimated during activity versus the measurement at rest (34 synapses from three fields of view). Each point is an individual synapse and the dashed line shows unity (no change). C, a plot of the FWHM of the RSF measured during high levels of activity versus the measurement at rest (same population of synapses as B). D, average projection of central 8 µm of an example reference stack showing labelled blood vessels. Coloured boxes, three equally sized ROIs spanning the image. E, estimates of axial displacement for each ROI (coloured traces) compared to that made using the whole image (black trace). The close agreement indicates relatively uniform z‐displacement in the x dimension.
