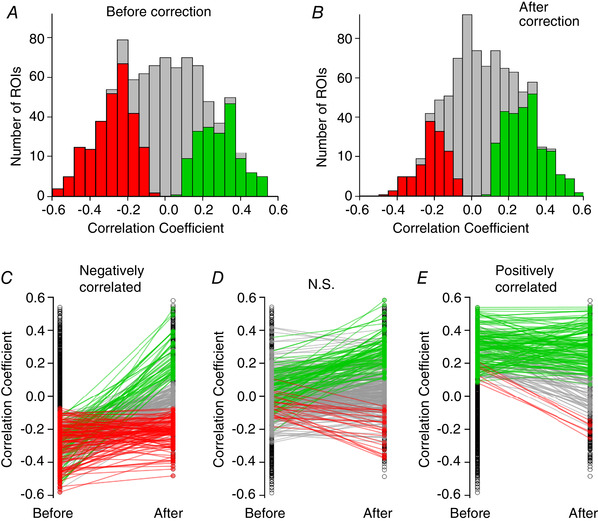
Figure 8. The impact of correcting for z‐motion on signals measured across a population of synapses.

A, distribution of correlation coefficients between synaptic activity trace and running speed, before correction for z‐motion. Results collected from 1321 synapses in two mice expressing SyGCaMP6f in VIP interneurons in V1 (layer 2/3). The majority of synapses show some correlation with locomotion. Coloured bars represent synapses that appear significantly correlated, either positively (green) or negatively (red). B, distribution of the same synapses after correction. The majority of synapses now show no significant correlation and a greater proportion are positively correlated. C–E, the destination of synapses with significant negative (C), not significant (D), or significantly positive (E) correlation coefficients to running speed prior to correction. Coloured lines and markers show the pairwise correlation coefficient changes for each ROI, showing a shift to positive (green), negative (red) or not significant (grey) correlations with running speed following correction.
