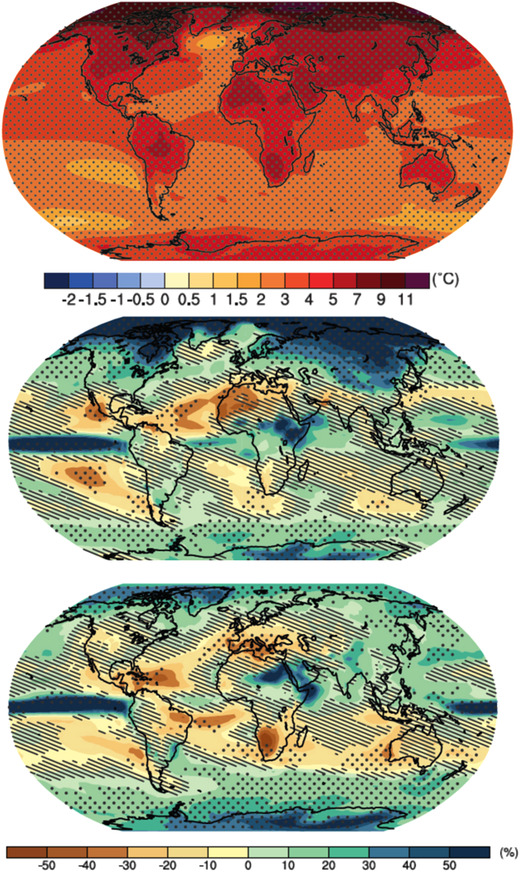
Figure 2.

CMIP5 projections of changes in annual mean temperature (top) and in boreal winter and summer precipitation (middle and bottom) by the end of the century under the RCP8.5 forcing scenario. Stippling indicates where the model projections are robust, in the sense of agreeing on the sign of the change; otherwise, the models do not agree. Hatching indicates where the average model changes are small compared with internal variability, but this does not mean that individual model changes are small. Warming is robust over all land areas. Precipitation changes can be of either sign and are nonrobust over the regions and seasons discussed in our case studies. From Ref. 64.
