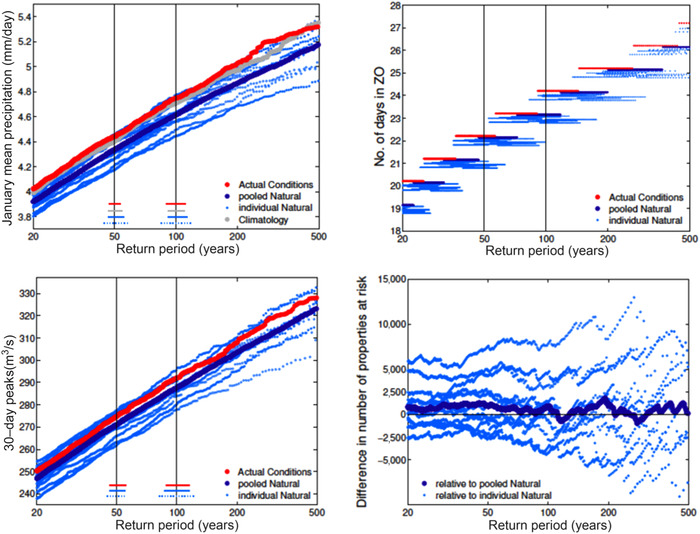
Figure 3.

The modeled effect of anthropogenic climate change on wintertime flooding in the Thames Valley, motivated by the flooding in winter 2013/2014. Top left: January mean precipitation over Southern England. Top right: Return periods for a “stuck” jet stream, labeled “ZO.” Bottom left: Return periods for 30‐day peak flows for the Thames at Kingston, close to London. Bottom right: Difference in number of properties at risk of flooding as a function of return period. The estimates from the factual calculation are shown as a set of red points, and from each counterfactual calculation (using different estimates of the anthropogenic change in sea‐surface temperatures) as a set of light blue points, with the average shown in dark blue. From Ref. 20, with permission.
