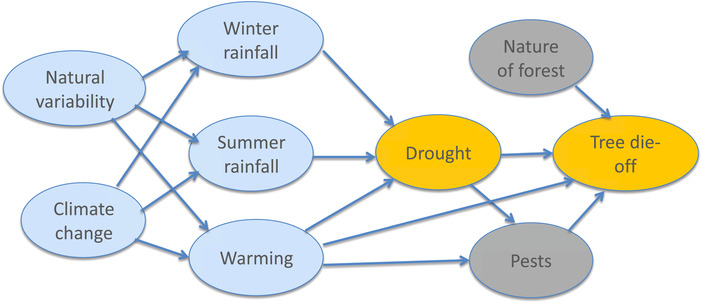
Figure 7.

Causal network for discussion of tree die‐off. Arrows indicate direction of causal influence but can include the effects of feedbacks. The blue shading indicates elements whose causality lies in the weather and climate domain, the gray shading those in the environment and ecosystems domain, and the orange shading a combination of the two. See text for further details concerning this example.
