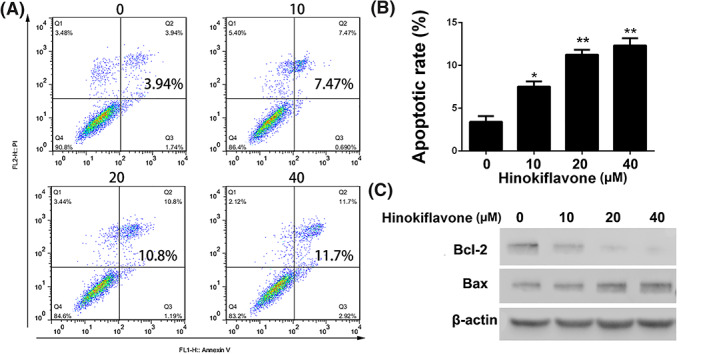
Figure 3.

Apoptosis induction of hinokiflavone in breast cancer cells. (A and B) MDA‐MB‐231 cells were treated with different concentrations of hinokiflavone for 24h. Apoptotic cells were stained with Annexin V‐FITC/PI and tested by FCM. (C) Western blot analysis of apoptosis associated proteins after treatment with hinokiflavone. Data are displayed as means ± SD from three independent experiments
