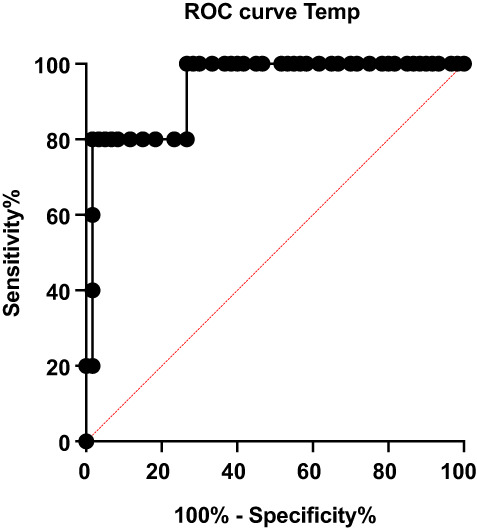
Figure 2.

ROC analysis of maximum temperature showed an areas under the curve (AUC) of 0.9367 (95% CI 0.84–1.0), P < 0.01 (A vs B). Likelihood ratio of 48 at 37.5°C.

ROC analysis of maximum temperature showed an areas under the curve (AUC) of 0.9367 (95% CI 0.84–1.0), P < 0.01 (A vs B). Likelihood ratio of 48 at 37.5°C.