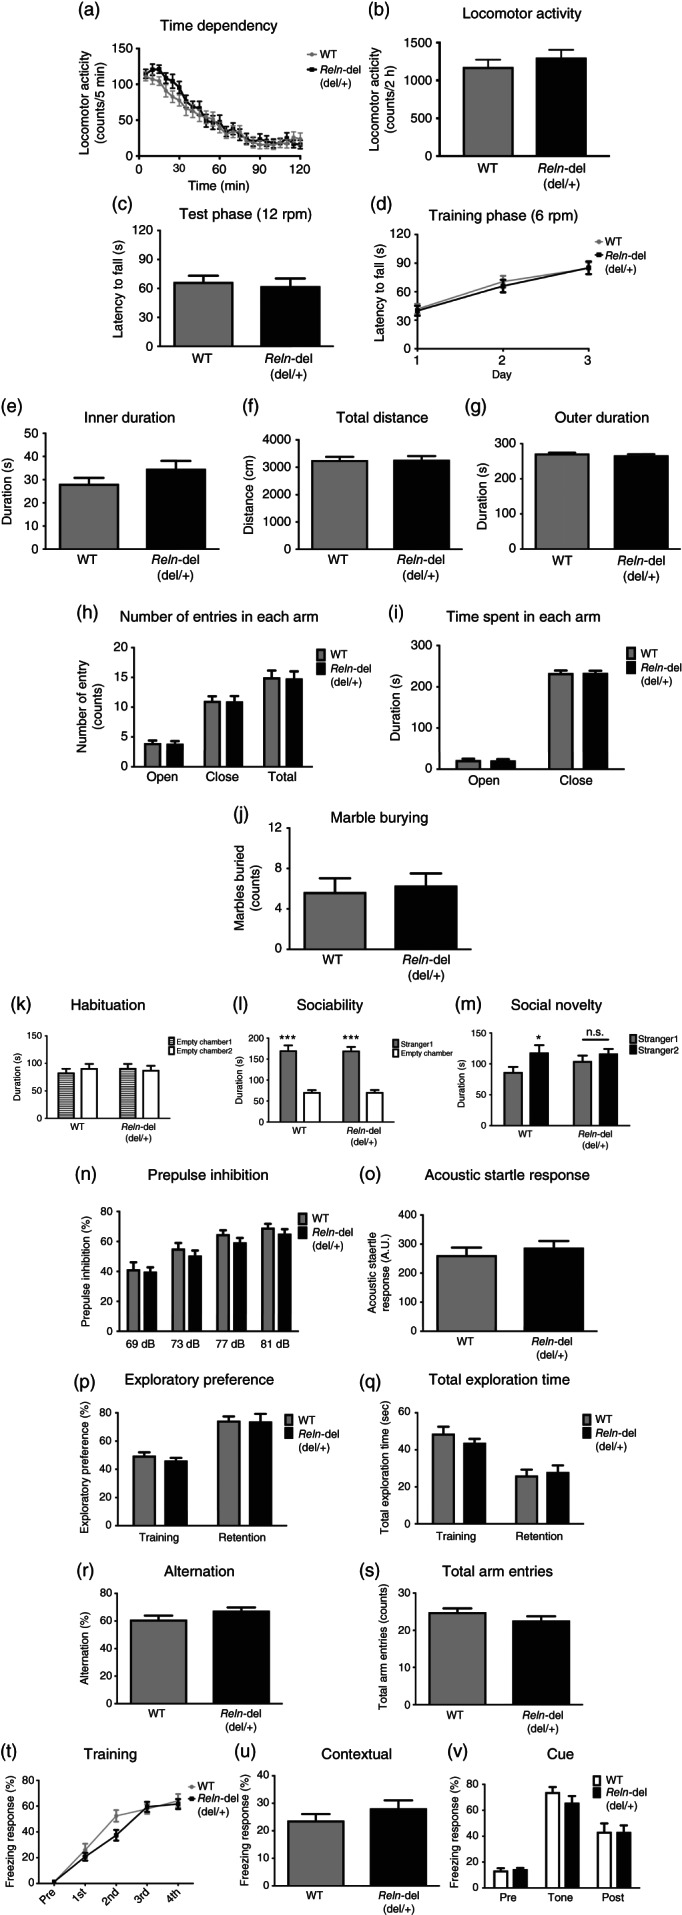
Figure 4.

Behavioral analyses in heterozygous Reln‐del mice. Performance in the (a,b) locomotor activity, (c,d) rotarod, (e–g) open field, (h,i) elevated plus maze, (j) marble‐burying, (n,o) pre‐pulse inhibition, (p,q) novel object recognition, (r,s) Y‐maze, and (t–v) fear‐conditioning tests. Data represent the mean ± standard error of the mean (SEM; n = 24 for wild‐type [WT] mice, n = 26 for Reln‐del mice in Fig. 4a,b; n = 24 for WT mice, n = 26 for Reln‐del mice in Fig. 4c,d; n = 24 for WT mice, n = 27 for Reln‐del mice in Fig. 4e–g; n = 24 for WT mice, n = 25 for Reln‐del mice in Fig. 4f,i; n = 12 for WT mice, n = 13 for Reln‐del mice in Fig. 4j; n = 24 for WT mice, n = 26 for Reln‐del mice in Fig. 4n,o; n = 12 for WT mice, n = 13 for Reln‐del mice in Fig. 4p,q; n = 22 for WT mice, n = 22 for Reln‐del mice in Fig. 4r,s; n = 12 for WT mice, n = 13 for Reln‐del mice in Fig. 4t–v). (k–m) Performance in the three‐chambered social interaction test: (k) habituation, (l) sociability, and (m) social novelty sessions. Data represent the mean ± SEM (n = 18–20 for WT mice, n = 20 for Reln‐del mice). ***P < 0.001 between empty chamber and stranger 1 or *P < 0.05 between stranger 1 and stranger 2 (two‐way analysis of variance with post‐hoc Sidak's multiple comparisons test).
