Figure 5.

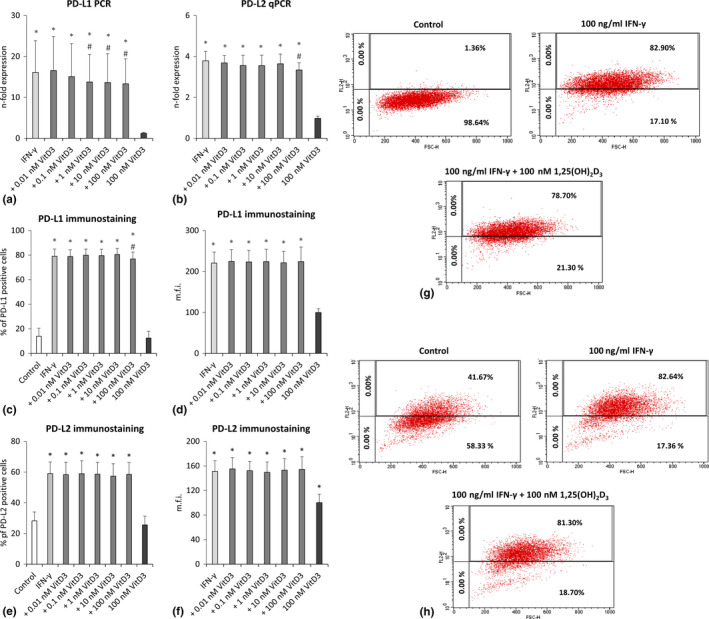
Effect of different 1,25(OH)2D3 concentrations on PD‐L1 and PD‐L2 expression in IFN‐γ treated hPDLCs. Primary hPDLCs were stimulated with different 1,25(OH)2D3 concentrations (0.01–100 nM) in the presence of 100 ng/ml IFN‐γ for 48 hr. PD‐L1 (a) and PD‐L2 (b) expression were investigated by qPCR, showing the n‐fold expression compared to the appropriate controls. GAPDH served as internal control. PD‐L1 and PD‐L2 surface protein expression was investigated by immunostaining and flow cytometry analysis followed by determining the % of PD‐L1 (c) and PD‐L2 (e) positive hPDLCs and the m.f.i. of PD‐L1 (d) and PD‐L2 (f) positive hPDLCs. Representative dot plots show the percentage of PD‐L1 (g) or PD‐L2 (h) positive hPDLCs (upper right quadrant). Quadrants were set using unlabelled control. All data are presented as mean value ± SEM from five independent experiments with hPDLCs isolated from five different individuals. *p‐value < .05 compared to the control; #p‐value < .05 compared to IFN‐γ alone
