

Abstract
Purpose
To validate the performance of a commercially available, CE‐certified deep learning (DL) system, RetCAD v.1.3.0 (Thirona, Nijmegen, The Netherlands), for the joint automatic detection of diabetic retinopathy (DR) and age‐related macular degeneration (AMD) in colour fundus (CF) images on a dataset with mixed presence of eye diseases.
Methods
Evaluation of joint detection of referable DR and AMD was performed on a DR‐AMD dataset with 600 images acquired during routine clinical practice, containing referable and non‐referable cases of both diseases. Each image was graded for DR and AMD by an experienced ophthalmologist to establish the reference standard (RS), and by four independent observers for comparison with human performance. Validation was furtherly assessed on Messidor (1200 images) for individual identification of referable DR, and the Age‐Related Eye Disease Study (AREDS) dataset (133 821 images) for referable AMD, against the corresponding RS.
Results
Regarding joint validation on the DR‐AMD dataset, the system achieved an area under the ROC curve (AUC) of 95.1% for detection of referable DR (SE = 90.1%, SP = 90.6%). For referable AMD, the AUC was 94.9% (SE = 91.8%, SP = 87.5%). Average human performance for DR was SE = 61.5% and SP = 97.8%; for AMD, SE = 76.5% and SP = 96.1%. Regarding detection of referable DR in Messidor, AUC was 97.5% (SE = 92.0%, SP = 92.1%); for referable AMD in AREDS, AUC was 92.7% (SE = 85.8%, SP = 86.0%).
Conclusion
The validated system performs comparably to human experts at simultaneous detection of DR and AMD. This shows that DL systems can facilitate access to joint screening of eye diseases and become a quick and reliable support for ophthalmological experts.
Keywords: age‐related macular degeneration, automated detection, deep learning, diabetic retinopathy, observer study, validation
Introduction
Screening for eye diseases has become a high‐priority healthcare service to prevent vision loss (Cunha‐Vaz 1998; Rowe et al. 2004). Due to its proven efficiency, screening programmes based on periodical examinations of the retina have been increasingly implemented worldwide (James et al. 2000; Arun et al. 2003; Jones & Edwards 2010). Established protocols rely on manual readings by highly specialized workforce (Piñero 2013), failing to meet the requirements of large‐scale screening in high‐ and low‐resource countries (Harmon & Merritt 2009; Shaw et al. 2010; Guariguata et al. 2014; Wong et al. 2014; United Nations Department of Economic and Social Affairs 2017). Furthermore, cost‐effectiveness remains to be the main burden for establishing screening programmes (Wormald 1999; Hernández et al. 2008; Karnon et al. 2008), and different protocols are followed for different diseases (AAO 2015, 2017), which translates to a larger burden to health systems and to the patient, that needs to undergo several of them. Nevertheless, exploiting the fact that examination protocols of retinal diseases rely mostly on the same principles and actions, it becomes more efficient to integrate them in one workflow (Chan et al. 2015; Chew & Schachat 2015).
Diabetic retinopathy (DR) has become a leading cause of preventable blindness worldwide with an overall prevalence of 35% among people with diabetes, which affects 1 in every 11 adults (Yau et al. 2012; IAPB 2016; IDF 2017). Age‐related macular degeneration (AMD) is the most common cause of blindness in developed countries, being 9% its worldwide prevalence (Wong et al. 2014). Up to 80% of blindness cases caused by these diseases are avoidable if detected early enough to undergo treatment (Pascolini & Mariotti 2012; WHO 2013). Nevertheless, their incidence is expected to increase within the following decades, due to population ageing and the increasing prevalence of diabetes adults (Yau et al. 2012; IAPB 2016; IDF 2017). Screening protocols for DR have been established in several countries (NHS 2014; NOG 2017). Regarding AMD, there is no established screening protocol, but it will soon be required (Jain et al. 2006; Ouyang et al. 2013), since treatment options are still limited, although under development (Comer et al. 2004; Gehrs et al. 2010; Zarbin & Rosenfeld 2010).
Automated screening solutions aim to provide a scalable, sustainable and high‐quality approach to meet the increasing demand, while reducing the burden on highly trained professionals and the associated costs. The introduction of deep learning (DL) has constituted a revolution in medical imaging analysis (LeCun et al. 2015; Litjens et al. 2017). Previous solutions for the automatic analysis of retinal images (Burlina et al. 2011; Abràmoff et al. 2013) have been outperformed by DL approaches (Raman et al. 2018; Schmidt‐Erfurth et al. 2018). Several DL systems for the automatic detection of DR (Abràmoff et al. 2016, 2018; Gulshan et al. 2016; Gargeya & Leng 2017) and AMD (Burlina et al. 2017; Grassmann et al. 2018; Peng et al. 2018) have showed performance close or even superior to that achieved by human graders. However, these systems perform independent analysis of each disease, although these diseases can coexist and a solution for joint detection would be beneficial (Chan et al. 2015; Chew & Schachat 2015; Ting et al. 2017).
In this study, we present the validation of a commercially available, CE‐certified DL software package, RetCAD v.1.3.0 (Thirona), that allows for joint detection of referable DR and AMD in colour fundus (CF) images. The aim is to analyse the capability of a DL system to simultaneously identify both diseases and compare it with human experts and the current state‐of‐the‐art methods, in order to determine the potential for automated joint screening of eye diseases. As main novel aspect of our work and in contrast to previous work on joint automated screening, such as Ting et al., we perform the validation for joint detection of DR and AMD on one unique dataset which includes simultaneously referable and non‐referable cases of both diseases, so as to analyse how the presence of each pathology influences joint screening performance.
Materials and Methods
Evaluation data
The validation of the DL system was first performed on a DR‐AMD dataset, which contains referable and non‐referable cases of DR and AMD, for the joint detection of both diseases. Additional validation of individual detection of DR and AMD was assessed on Messidor and the Age‐Related Eye Disease Study (AREDS) dataset, respectively.
The DR‐AMD dataset was extracted from a set of images collected in three different European medical centres (Sweden, Denmark, Spain). In total, 8871 images from more than 2000 patients were acquired during routine clinical practice between August 2011 and October 2016, with a CR‐2PlusAF fundus camera (Canon, Tokyo, Japan), at 45‐degree field of view with an image resolution between 2376 × 1584 and 5184 × 3456 pixels. No mydriasis was applied. Informed written consent was obtained from all patients at the medical centres and images were anonymized prior to transfer and use in this study, following the tenets set forth in the Declaration of Helsinki. The 8871 images went through a human quality check, regarding contrast, clarity and focus, where 1757 images were excluded. The remaining 7114 images went through a preliminary grading, performed by an observer with over 6 years of experience reading CF images. Images were classified as referable AMD (1234 images), referable DR (393 images) or control (5533 images), which indicates non‐referability for both DR and AMD, although other diseases might be present. Lastly, a random selection of 600 images was performed, containing 325 controls, 134 referable AMD cases and 144 referable DR cases (3 images with both referable AMD and DR). These images belong to 288 different patients, with an average of 2.11 images and 1.18 visits per patient. The 600 images define the DR‐AMD set used for validation of joint detection of DR and AMD. The remaining gradable images were used for system development, excluding those which belonged to patients included in the DR‐AMD dataset. The diagram in Fig. S1 summarizes the extraction of the dataset.
Messidor is a publicly available collection of macula‐centred CF images commonly used for performance comparison between automated DR detection systems. This dataset consists of 1200 images acquired by three different ophthalmologic departments using a 3CCD camera on a Topcon TRC NW6 non‐mydriatic retinography with a 45‐degree field of view, with an image resolution of 1440 × 960, 2240 × 1488 or 2304 × 1536 pixels. A total of 800 images were acquired with pupil dilation and 400 without dilation (Decencière et al. 2014; ADCIS, Messidor dataset).
Age‐Related Eye Disease Study (AREDS) dataset is currently the largest available set for AMD, previously used for the validation of automated AMD detection. Age‐Related Eye Disease Study (AREDS) was designed as a long‐term prospective study of AMD development and cataract in which patients were regularly examined and followed up to 12 years (NEI, AREDS dbGaP Study Accession). Institutional review board approvals were obtained from each clinical centre involved in the study, and written informed consent was obtained from each participant. The AREDS dbGaP set includes digitalized CF images. In 2014, over 134 000 macula‐centred CF images from 4613 participants were added to the set. We excluded images containing a lesion which disqualified an eye from the study, images considered as not gradable, and those which belong to eyes that were not included in the study, as mentioned in the AREDS dbGaP guidelines (NEI, AREDS dbGaP Data Tables). In total, 133 821 were used in this study.
Grading
To establish the reference standard (RS) in the DR‐AMD dataset, the 600 images were scored by stage of disease severity for both DR and AMD by a certified ophthalmologist with more than twelve years of experience (IC). In the case of DR, the grading is based on the International Clinical Diabetic Retinopathy (ICDR) severity scale, with stages 0 (no DR), 1 (mild non‐proliferative DR), 2 (moderate non‐proliferative DR), 3 (severe non‐proliferative DR) and 4 (proliferative DR) (Wilkinson et al. 2003). For AMD, the grading protocol is based on the AREDS system, with stages 1 (no AMD), 2 (early AMD), 3 (intermediate AMD) and 4 (advanced AMD; with presence of foveal geographic atrophy or choroidal neovascularization) (AREDS Research Group 2001). The measuring grid often used as part of the AREDS protocol was not applied for grading the DR‐AMD dataset, taking into account lesions in the whole image and not only those located within the grid area.
For comparison with human performance at joint detection of DR and AMD, four independent observers also provided a score for each disease. Two of the graders were certified ophthalmologists with between 1 and 3 years of experience (VS, PH) and the other two graders were ophthalmology residents in their last year of residency (YL, AD).
The gradings from the RS and the independent observers were then adjusted for the adaptation of the detection of both diseases into two separate binary classifications. In the case of DR: non‐referable DR (stage 0 or 1) and referable DR (stage 2, 3, or 4); for AMD: non‐referable AMD (stage 1 or 2) and referable AMD (stage 3 or 4). Cases without both referable DR and referable AMD are referred to as controls from now on. Note that this implies non‐referability for both DR and AMD, but other eye diseases might be present.
The reference standard for Messidor was made publicly available when the dataset was originally published, with the subsequent correction of the published errata until the realization of this study in 2018 (ADCIS, Messidor dataset). Medical experts provided the retinopathy grade for each image, consisting of four distinct categories, from 0 to 3, ranging from normal to increasing severity of DR. In order to translate this RS into referable/non‐referable classification, images assigned with DR stage 0 or 1 were considered non‐referable cases; those with DR stage 2 or 3, referable. For human performance comparison, manual annotations were performed by two independent graders, a general ophthalmologist and a retinal specialist, with 4 and 20 years of DR screening experience, respectively, following the same protocol as the RS (Sánchez et al. 2011).
The reference standard for the AREDS dataset corresponds to the publicly available grading in AREDS dbGaP, which is based on the AREDS severity scale for AMD described previously (AREDS Research Group 2001; NEI, AREDS dbGaP Data Tables). These scores were assigned to the images by experts at US grading centres, being consistent with the original AREDS AMD categorization without considering visual acuity (NEI, AREDS Manual of Operations Study Design). This RS was then adapted following the mentioned procedure into referable and non‐referable cases for performing binary classification.
Table 1 summarizes distribution of disease severity for DR and AMD in the validation datasets regarding the corresponding reference standard.
Table 1.
Disease severity distribution for DR and AMD in the validation datasets.
| Disease stage | DR‐AMDa , b | Messidorc | AREDSb | ||||
|---|---|---|---|---|---|---|---|
| DR | |||||||
| NR | 0 | 489 (81.5) | 487 (81.2) | 700 (58.3) | 547 (45.6) | – | – |
| 1 | 2 (0.3) | 153 (12.7) | – | ||||
| R | 2 | 111 (18.5) | 82 (13.6) | 500 (41.7) | 247 (20.6) | – | – |
| 3 | 4 (0.7) | 253 (21.1) | – | ||||
| 4 | 25 (4.2) | – | – | ||||
| AMD | |||||||
| NR | 1 | 527 (87.8) | 483 (80.5) | – | – | 74 401 (55.6) | 41 409 (30.9) |
| 2 | 44 (7.3) | – | 32 992 (24.7) | ||||
| R | 3 | 73 (12.2) | 54 (9.0) | – | – | 59 420 (44.4) | 41 495 (31.0) |
| 4 | 19 (4.2) | – | 17 925 (13.4) | ||||
| Total images with available grading, No. (%) | 600 (100) | 1200 (100) | 133 821 (100) | ||||
AMD = age‐related macular degeneration; DR, diabetic retinopathy; NR, non‐referable; R, referable.
Reference standard for DR grading is ICDR (stages from 0 to 4).
Reference standard for AMD grading is AREDS (stages from 1 to 4).
Reference standard for DR grading is Messidor (stages from 0 to 3).
Automated grading approach
The DL system under validation uses convolutional neural networks (CNN) for the classification task of grading (LeCun et al. 1998; Krizhevsky et al. 2012; Simonyan & Zisserman 2014; Szegedy et al. 2015, 2017). Convolutional neural networks (CNNs) are organized in multiple layers with artificial neurons, which learn representations of the input data at increasing levels of abstraction (Schmidt‐Erfurth et al. 2018). Convolution operations act as feature detectors with adjustable parameters called weights. During training, the network is presented with a large set of annotated images. For each image, an output class label is produced in a forward pass through the network and a loss function is computed to measure the error between the output and the actual label. With the aim of reducing the error, the weights are adjusted by means of backpropagation (LeCun et al. 2015). This process is repeated with several passes over the training data until the loss converges.
RetCAD v.1.3.0 allows for joint detection of referable DR and AMD in CF images. Firstly, each input image goes through a preprocessing stage that generates a preprocessed RGB image and a contrast‐enhanced (CE) image. The preprocessed RGB image is used for an assessment of image quality. Then, joint image‐level detection of DR and AMD is performed by means of two ensembles based on three different state‐of‐the‐art CNN architectures with multiple blocks of convolutional layers followed by max‐pooling layers, including dense blocks and depthwise separable convolutions (Antony & Brüggemann 2015; Chollet 2017; Huang et al. 2017). Each ensemble consists of six individual CNNs: three CNNs use the preprocessed RGB image as input; the other three CNNs, the CE image. The final score for each disease is obtained by averaging the scores generated by the networks in each ensemble. Each ensemble provides one score between 0 and 100 which is monotonically related to the likelihood of presence of referable DR and AMD, respectively. The diagram in Fig. 1 illustrates the workflow of the system.
Figure 1.
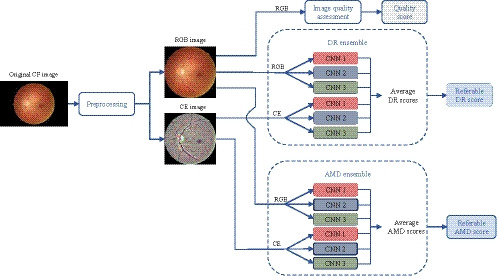
Workflow of RetCAD v.1.3.0. Each CF input image goes first through a preprocessing stage that generates a preprocessed RGB image and a CE image. The preprocessed RGB image is used for an assessment of image quality. Joint image‐level detection of DR and AMD is performed by means of two ensembles based on three different state‐of‐the‐art CNN architectures (CNN 1, CNN 2, CNN 3), with multiple blocks of convolutional layers followed by max‐pooling layers, including dense blocks and depthwise separable convolutions (Antony & Brüggemann 2015; Chollet 2017; Huang et al. 2017). Each ensemble consists of six individual CNNs: three CNNs use the preprocessed RGB image as input; the other three CNNs, the CE image. The final score for each disease is obtained by averaging the scores generated by the networks in each ensemble. Each ensemble provides one score between 0 and 100 which is monotonically related to the likelihood of presence of referable DR and AMD, respectively. AMD, Age‐related macular degeneration; CE, Contrast‐enhanced; CF, Colour fundus; CNN, Convolutional neural network; DR, Diabetic retinopathy.
None of the images included in the datasets used in this validation study were used for training the system.
Evaluation design
To evaluate the performance of the system at automated joint detection of referable DR and AMD, we performed several validation experiments on the DR‐AMD dataset. For detection of referable DR, binary classification was assessed between DR cases and the joint set of controls and AMD cases (DR vs. AMD + controls). A second binary classification for DR was performed between referable and only control cases, in order to analyse the influence of joint AMD cases in the performance of the system (DR vs. controls). The same procedure was applied for detection of referable AMD, assessing first a binary classification between AMD cases and the joint set of controls and DR cases (AMD vs. DR + controls), and a subsequent binary classification between AMD and only control cases (AMD vs. controls).
Regarding validation of individual detection of referable DR and AMD, binary classification was performed between referable and non‐referable DR cases in Messidor, and between referable and non‐referable AMD cases in the AREDS dataset.
The performance metrics used for validation were sensitivity (SE) and specificity (SP), defined as the proportions of cases considered referable and non‐referable, respectively, by both the system and the reference standard. The trade‐off between both metrics was furtherly observed by means of receiver operating characteristic (ROC) analysis. The optimal operating point of the system was considered to be the best trade‐off between SE and SP, that is, the point closest to the upper left corner of the graph. For an overall interpretation of the system's ability to discriminate between referable and non‐referable cases, the area under the ROC curve (AUC) was computed. Human performance was also evaluated by computing sensitivity and specificity from the gradings of each observer and then included in the corresponding ROC curve as operating points.
Data bootstrapping was used to assess statistical significance of the obtained evaluation metrics (Efron & Tibshirani 1993). Samples were bootstrapped 1000 times to generate a distribution of each evaluation metric, obtaining the 2.5 and 97.5 percentiles as 95% confidence intervals (CI).
In the validation datasets where gradings by independent observers were available, that is, DR‐AMD dataset and Messidor, intergrader variability was measured by means of the quadratic Cohen's weighted kappa coefficient (κ), between gradings per disease stage and the corresponding reference standard (Hripcsak & Heitjan 2002).
Lastly, we performed an additional experiment in order to validate the DL system on data distributions similar to the ones encountered in real screening programmes, as well as to analyse the changes in its performance for joint detection of DR and AMD with modifications in disease prevalence. For this purpose, we incremented the number of non‐referable cases in the DR‐AMD dataset, by including those cases from the 7114 gradable images assessed as controls in the preliminary grading and not used for development of the system. A total of 469 controls could be added to the 600‐images DR‐AMD set. This experimental dataset was constituted therefore by 1069 images: 134 referable AMD cases, 144 referable DR cases and 794 controls, decreasing the disease prevalence of DR to 10%, and the prevalence of AMD to 7%. For each disease separately, we varied the proportion of positive cases in the experimental set and simulate different levels of prevalence. For the simulation of lower DR prevalence, DR positive cases were sequential and randomly added, until reaching the original number of positive cases in the experimental set, keeping the number of AMD cases and controls unmodified. For simulating higher DR prevalence, until reaching the prevalence in the DR‐AMD set, controls were sequential and randomly excluded. The same process was followed for analysing changes with AMD prevalence. Since the evaluation metrics used in the other validation experiments (SE, SP, AUC) are invariant to changes in disease prevalence (Zweig & Campbell 1993), we have used the accuracy, the positive predictive value (PPV) and the negative predictive value (NPV), with the corresponding 95% CI, as performance metrics for this validation.
Results
For the 600 images in the DR‐AMD dataset, the ROC analysis corresponding to DR vs. AMD + controls is shown in Fig. 2A. The optimal operating point of RetCAD v.1.3.0 corresponds to SE of 90.1% (95% CI, 84.2%–96.6%) and SP of 90.6% (95% CI, 85.9%–97.0%), with AUC of 95.1% (95% CI, 90.8%–98.2%). Average observer SE and SP were 61.5% and 97.8%, respectively. Figure 2B shows the ROC curve and optimal operating point by the DL system regarding AMD vs. DR + controls. SE was 91.8% (95% CI, 84.4%–97.6%), SP was 87.5% (95% CI, 83.5%–97.9%), and AUC was 94.9% (95% CI, 90.9%–97.9%). Average observer SE and SP were 76.5% and 96.1%, respectively. Table 2 summarizes diagnostic performance of the system and the human observers for both validation experiments.
Figure 2.
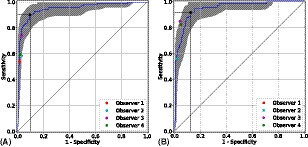
Receiver operating characteristic curves for joint detection of referable DR (A) and AMD (B) in the DR‐AMD dataset (600 images). Performance of RetCAD v.1.3.0 corresponds to the blue curves (95% CI within grey area); the coloured circles, to the human observers. The black circle indicates the SE and SP of RetCAD v.1.3.0 at its optimal operating point. For DR vs. AMD + controls (A), AUC was 95.1% (95% CI, 90.8%–98.2%), SE was 90.1% (95% CI, 85.2%–96.8%) and SP was 90.6% (95% CI, 85.5%–96.7%). For AMD vs. DR + controls (B), AUC was 94.9% (95% CI, 90.9%–97.9%), SE was 91.8% (95% CI, 84.6%–97.8%) and SP was 87.5% (95% CI, 83.5%–93.9%). AMD, age‐related macular degeneration; AUC, area under the receiver operating characteristic curve; CI, confidence interval; DR, diabetic retinopathy; SE, sensitivity; SP, specificity.
Table 2.
Diagnostic performance for joint detection of referable DR and AMD of RetCAD v.1.3.0 and observers compared with reference standard in the DR‐AMD dataset (600 images).
| DR | RetCAD | Obs. 1 | Obs. 2 | Obs. 3 | Obs. 4 | |||||
|---|---|---|---|---|---|---|---|---|---|---|
| R | NR | R | NR | R | NR | R | NR | R | NR | |
| RS | ||||||||||
| R | 99 | 12 | 60 | 51 | 65 | 46 | 82 | 29 | 66 | 45 |
| NR (AMD, C) | 46 (8, 38) | 443 | 7 (1, 6) | 482 | 14 (4, 10) | 475 | 14 (1, 13) | 475 | 9 (1, 8) | 480 |
| SE (%) (95% CI) | 90.1 (85.2–96.8) | 54.1 (40.1–67.3) | 58.6 (46.3–70.9) | 73.9 (61.4–85.2) | 59.5 (46.7–72.0) | |||||
| SP (%) (95% CI) | 90.6 (85.5–96.7) | 98.6 (97.0–99.6) | 97.1 (94.8–99.2) | 97.1 (94.7–99.2) | 98.2 (96.2–99.6) | |||||
| AMD | R | NR | R | NR | R | NR | R | NR | R | NR |
|---|---|---|---|---|---|---|---|---|---|---|
| RS | ||||||||||
| R | 66 | 7 | 60 | 13 | 41 | 32 | 62 | 11 | 60 | 13 |
| NR (DR, C) | 66 (16, 50) | 461 | 26 (8, 18) | 501 | 8 (3, 5) | 519 | 22 (7, 15) | 505 | 26 (5, 21) | 501 |
| SE (%) (95% CI) | 91.8 (84.6–97.8) | 82.1 (69.0–93.8) | 56.2 (39.5–71.8) | 84.9 (72.5–96.0) | 82.1 (69.7–93.5) | |||||
| SP (%) (95% CI) | 87.5 (83.5–93.9) | 95.1 (92.2–97.5) | 98.5 (96.9–99.6) | 95.8 (93.1–98.1) | 95.1 (92.2–97.5) | |||||
AMD = age‐related macular degeneration; C, control; CI, confidence interval; DR, diabetic retinopathy; NR, non‐referable; Obs., observer; R, referable; RS, reference standard; SE, sensitivity; SP, specificity.
Regarding validation of DR vs. controls on the DR‐AMD dataset, AUC was 95.6% (95% CI, 91.8%–98.6%), SE was 91.7% (95% CI, 85.3%–98.0%) and SP was 90.9% (95% CI, 86.7%–96.7%). As for AMD vs. controls, AUC was 95.2% (95% CI, 91.0%–98.1%), SE was 88.6% (95% CI, 83.8%–100.0%) and SP was 92.1% (95% CI, 84.3%–95.2%). The corresponding ROC analysis and distribution of both classification results of RetCAD v.1.3.0 and the observers can be found in Fig. S2 and Table S1.
Intergrader disagreement in the DR‐AMD dataset is shown in Fig. 3, which includes interrater heatmaps with quadratic‐weighted κ scores among the four observers and the reference standard, for DR and AMD.
Figure 3.
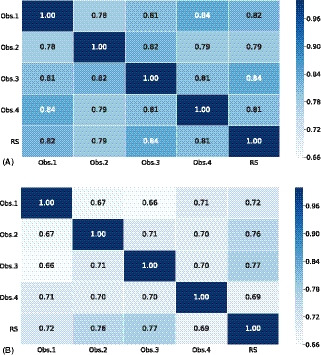
Intergrader disagreement in DR (A) and AMD (B) grading stages among independent human observers and reference standard in the DR‐AMD dataset (600 images). Interrater heatmaps with quadratic Cohen's weighted kappa coefficients comparing disease staging for DR (A) and AMD (B) among the 4 independent human observers and the reference standard in the DR‐AMD dataset (600 images with referable DR, AMD and control cases). DR, diabetic retinopathy; AMD, age‐related macular degeneration; Obs., observer; RS, reference standard.
Regarding the performance validation of the system and external observers at detection of referable DR in Messidor, the obtained results can be found in Fig. 4A. The AUC was 97.5% (95% CI, 96.3%–98.5%), SE was 92.0% (95% CI, 89.3%–97.2%) and SP was 92.1% (95% CI, 88.6%–95.2%). Diagnostic performance by the system and the two observers is summarized in Table S2, while Fig. S3 shows the intergrader discrepancy among observers and the reference standard.
Figure 4.
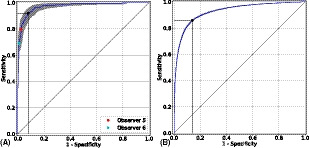
Receiver operating characteristic curves for individual detection of referable DR in Messidor (1200 images) (A) and referable AMD in the AREDS dataset (133 821 images) (B). Performance of RetCAD v.1.3.0 corresponds to the blue curves (95% CI within grey area); the coloured circles, to the human observers. The black circle indicates the SE and SP of RetCAD v.1.3.0 at its optimal operating point. For individual detection of referable DR (A), AUC was 97.5% (95% CI, 96.3%–98.5%), SE was 92.0% (95% CI, 89.3%–97.2%) and SP was 92.1% (95% CI, 88.6%–95.2%). For individual detection of referable AMD (B), AUC was 92.7% (95% CI, 92.5%–92.9%), SE was 85.8% (95% CI, 84.6%–86.2%) and SP was 86.0% (95% CI, 85.7%–87.4%). AMD, age‐related macular degeneration; AUC, area under the receiver operating characteristic curve; CI, confidence interval; DR, diabetic retinopathy; SE, sensitivity; SP, specificity.
The results of the ROC analysis for automated detection of referable AMD in the AREDS dataset are shown in Fig. 4B. For the 133 821 images, the DL system reached 85.8% (95% CI, 84.6%–86.2%) for SE and 86.0% (95% CI, 85.7%–87.4%) for SP. Area under the ROC curve (AUC) was 92.7% (95% CI, 92.5%–92.9%). The classification results regarding the reference standard can be found in Table S3.
Lastly, Figure 5 depicts the changes in the performance (ACC, PPV, NPV) of the DL system for joint DR and AMD detection when the prevalence of each disease is sequentially modified.
Figure 5.
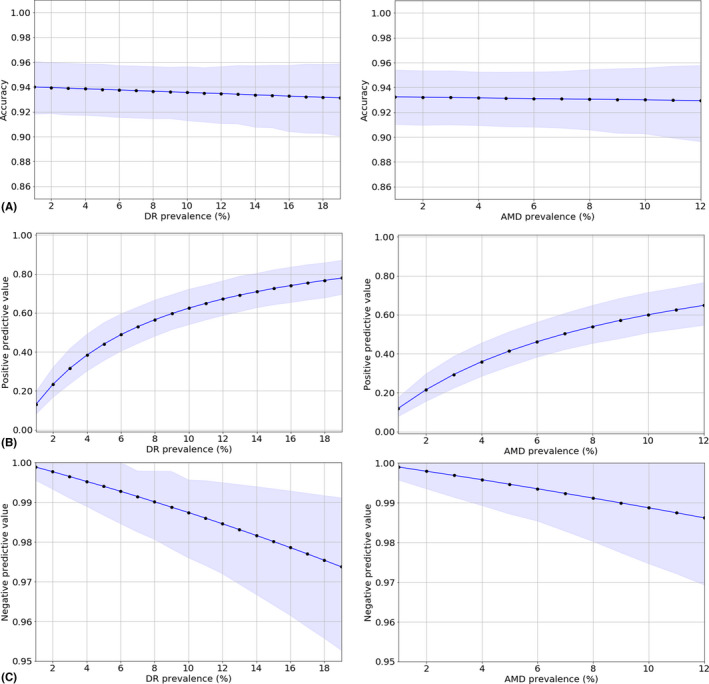
Performance of RetCAD v.1.3.0 for joint detection of DR and AMD with changes in disease prevalence: accuracy (A), positive predictive value (B), and negative predictive value (C). For each disease separately, we varied the proportion of positive cases and simulate different levels of prevalence in an experimental set constituted by the 600 images in the DR‐AMD dataset and 469 additional controls (cases from the 7114 gradable images assessed as controls in the preliminary grading and not used for development of the system). This experimental dataset was constituted therefore by 1069 images, with a prevalence of DR of 10%, and a prevalence of AMD of 7%. AMD, age‐related macular degeneration; DR, diabetic retinopathy.
Discussion
In this study, we validated the performance for joint detection of referable DR and AMD of a commercially available, CE‐certified DL system, RetCAD v.1.3.0 (Thirona) and compared it with independent human observers. The results in the DR‐AMD dataset show the system is able to differentiate between the two diseases, which is one of the main aspects in joint detection, since the presence of other pathologies may affect the performance of a DL system when detecting a given disease (Li et al. 2018). When identifying referable DR, false‐positive detections corresponded to 9.4% of the cases graded as non‐referable DR in the reference standard, which can be divided into controls or referable AMD cases, being the latter the 17.4% of the cases wrongly classified as referable DR. Regarding false‐positive cases at detection of referable AMD, 12.5% of non‐referable AMD cases were wrongly classified, from which 24.2% were graded as referable DR in the reference standard; for those misclassified cases graded as control in the reference, it was observed that slightly more than half had early AMD. Regarding false negatives in DR detection, 10.8% referable cases were missed by the system, all of them graded as moderate non‐proliferative DR in the reference standard and 16.7% with simultaneous presence of referable AMD (intermediate AMD). In the case of AMD detection, 9.6% of referable cases were missed, without cases affected by DR, although less than one third had intermediate AMD. It can be observed, therefore, that for both diseases most misclassifications correspond to controls in the case of false positives and lower intra‐disease scoring in the case of false negatives, instead of corresponding to cases affected by referable stages of the other disease. Furthermore, the performance of the system is not significantly altered when individual disease detection is assessed on the same dataset.
The outcome of the joint validation also demonstrates the DL system performs comparably to human experts. RetCAD v.1.3.0 reaches lower specificity levels than human average, but higher sensitivity for both DR and AMD. This is particularly important at automated screening settings, where fewer referable cases must be missed when the system is used for either initial assessment or grading support.
Regarding intergrader variability, greater disagreement was observed for AMD, which might show the necessity of establishing AMD screening protocols as the ones already used for DR. For DR, we observed relatively low sensitivity scores for the observers regarding the reference standard, since many of the cases classified as stage 2 in the reference were graded by observers as stage 1. However, interobserver scores are still relatively high. This indicates graded stages are close, but intermediate DR levels become problematic for referable/non‐referable classification.
DL‐based automated joint detection was also assessed by Ting et al. (2017), reaching lower AUC values at detection of referable DR and AMD, although larger datasets were used for validation and detection of glaucoma was also evaluated. However, fewer external observers were included and different validation sets were used for identification of DR and AMD, which leaves the influence of each disease at joint screening unclear.
Regarding the performance of the DL system for joint DR and AMD detection with changes in disease prevalence, it can be observed for both diseases that, for very low prevalence levels, where only a few positive cases are present, the system tends to detect additional controls as positive (low positive predictive value), whereas the negative predictive value reaches its maximum, indicating that a low number of referable cases remain undetected. Greater variations can be observed in the PPV, which reaches higher values as prevalence increases, than in the NPV and the accuracy, which maintain high and relatively constant values.
Validation of individual detection of referable DR in Messidor shows exceptional performance by RetCAD v.1.3.0, also comparable to human experts. Intermediate DR stages are generally more difficult to identify (97.6% of false negatives belong to stage 2 and 92.7% of false positives belong to stage 1), as noted previously with the human observers in the DR‐AMD dataset. Nevertheless, detection errors are kept remarkably low.
Previous DL approaches for DR detection have been reported in Messidor‐2 (LaTIM 2011) with optimal performances. Since there is no publicly available image‐based reference standard for this extension of Messidor, we reported on the original set to allow for further comparison. Gulshan et al. (2016) used their own reference standard for Messidor‐2, whereas patient‐based reference standard was made available and applied by Abràmoff et al. (2013, 2016) (University of Iowa Health Care). We used this RS for additional validation in Messidor‐2 (see Appendix S1, Figure S4 and Table S4).
The results of individual detection of referable AMD in the AREDS dataset show that, as with DR, misclassifications shift towards intermediate stages (86.0% of false positives belong to cases graded as AMD stage 2 in the reference standard, whereas 67.1% of false negatives belong to stage 3). RetCAD v.1.3.0 performs at a good level, considering the images in this set are digitized analog photographs. Burlina et al. (2017) also reported on DL‐based referable AMD detection in the whole AREDS dataset, using the set also for training, which might explain better performance.
Limitations and future work
Although the output score of the validated DL system for DR and AMD is related to the presence of each disease, there is no clear cut‐off for disease staging, which could be especially beneficial for easier identification of intermediate stages, since they tend to be more ambiguous to diagnose.
In terms of general robustness for clinical use, in a recent study (Abràmoff et al. 2018) where the FDA authorized the first DL system for automated DR detection to be used by healthcare providers, the FDA preestablished superiority end‐points (85% and 82.5% for sensitivity and specificity, respectively) to be reached by the system in order to be considered robust enough for clinical use. All the sensitivity and specificity values achieved by the CE‐certified, commercially available system under validation at detection of DR and AMD in the different validation datasets are higher than the FDA values preestablished for the mentioned study. However, a prospective evaluation needs to be performed to correctly evaluate the system's performance in real clinical settings.
This validation shows the capacity of a commercially available DL system to assess joint detection of DR and AMD. However, future integration of automated detection of other eye diseases that might coexist, such as glaucoma and cataracts, might increase usability and support at screening settings.
Additionally, integrating other imaging modalities such as optical coherence tomography could provide valuable information for diagnosis. However, due to cost‐effectiveness and easier adaptation in telemedicine (Cuadros & Bresnick 2009), CF imaging facilitates screening of eye diseases, especially in developing countries.
With respect to this study, the human observers were professional ophthalmologists or ophthalmologists in training, who are used to clinical working settings and tasks, where the prevalence of disease and manual grading tasks differ from those of real screening settings. Besides, for evaluation of joint detection performance, one DR‐AMD set of 600 images from 288 patients was used. In this dataset, patients might contain images from different visits, and in some cases, several images from the same visit. Future studies on automated joint screening would benefit from more and larger validation datasets, with more subjects and increased intersubject variability, which would allow to analyse the effect of higher patient and imaging diversity on the performance of automated approaches. Additionally, these datasets would be even more beneficial by including graded cases with different severity levels for DR, AMD and additional eye diseases.
In conclusion, this validation study shows the capability of a commercially available, CE‐certified DL system to assess simultaneous detection of DR and AMD with performance comparable to human experts. This demonstrates that an automated solution for joint detection would be beneficial at screening settings, since eye diseases can coexist and examination protocols rely on the same principles and actions, while reducing subjectivity due to interobserver disagreement. This also shows that DL systems can facilitate access to screening of eye diseases, both in high‐ and low‐resource areas, and become a quick and reliable support for ophthalmological experts.
Supporting information
Figure S1. Extraction of the DR‐AMD dataset.
Figure S2. Receiver operating characteristic curves for individual detection of referable DR and AMD in the DR‐AMD dataset.
Figure S3. Interrater disagreement in DR grading stages among independent human observers and reference standard in Messidor (1200 images).
Figure S4. Receiver operating characteristic curve for individual detection of referable DR in Messidor‐2 (874 subjects).
Table S1. Diagnostic performance for individual detection of referable DR and AMD of RetCAD v.1.3.0 and observers compared with reference standard in the DR‐AMD dataset.
Table S2. Diagnostic performance for individual detection of referable DR of RetCAD v.1.3.0 and observers compared with reference standard in Messidor (1200 images).
Table S3. Diagnostic performance for individual detection of referable AMD of RetCAD v.1.3.0 compared with reference standard in the AREDS dataset (133821 images).
Table S4. Diagnostic performance for individual detection of referable DR of RetCAD v.1.3.0 compared with reference standard in Messidor‐2 (874 subjects).
Appendix S1. Validation of individual detection of referable DR in Messidor‐2.
This work was supported by the Dutch Technology Foundation STW, which is part of the Netherlands Organisation for Scientific Research (NWO) and partly funded by the Ministry of Economic Affairs (Perspectief programme P15‐26 ‘DLMedIA: Deep Learning for Medical Image Analysis’). The funders had no role in the design and conduct of the study; collection, management, analysis, and interpretation of the data; and preparation and submission of the manuscript for publication. Prof van Ginneken is co‐founder, shareholder and chief scientific officer of Thirona. He and his group receive royalties and funding not related to the current work from Thirona, Siemens Healthineers, Canon Medical Systems, ScreenPoint, MeVis Medical Solutions AG, and Delft Imaging Systems. The contents of this study are solely the responsibility of the authors and do not necessarily represent the official views of Thirona, Nijmegen, the Netherlands.
References
- AAO (2015): PPP Retina/Vitreous Panel, Hoskins Center for Quality Eye Care. Preferred practice pattern: age‐related macular degeneration – Updated 2015. Available at: https://www.aao.org/preferred-practice-pattern/age-related-macular-degeneration-ppp-2015. (Accessed on 4 March 2019).
- AAO (2017): Retina/Vitreous Panel, Hoskins Center for Quality Eye Care. Preferred practice pattern: diabetic retinopathy ‐ Updated 2017. Available at: https://www.aao.org/preferred-practice-pattern/diabetic-retinopathy-ppp-updated-2017. (Accessed on 4 March 2019).
- Abràmoff MD, Folk JC, Han DP et al. (2013): Automated analysis of retinal images for detection of referable diabetic retinopathy. JAMA Ophthalmol 131: 351–357. [DOI] [PubMed] [Google Scholar]
- Abràmoff MD, Lou Y, Erginay A, Clarida W, Amelon R, Folk JC & Niemeijer M (2016): Improved automated detection of diabetic retinopathy on a publicly available dataset through integration of deep learning. Invest Ophthalmol Vis Sci 57: 5200–5206. [DOI] [PubMed] [Google Scholar]
- Abràmoff MD, Lavin PT, Birch M, Shah N & Folk JC (2018): Pivotal trial of an autonomous AI‐based diagnostic system for detection of diabetic retinopathy in primary care offices. NPJ Digit Med 1: 39. [DOI] [PMC free article] [PubMed] [Google Scholar]
- ADCIS . Messidor dataset. Available at: http://www.adcis.net/en/DownloadThirdParty/Messidor.html. (Accessed on 4 March 2019).
- Antony M & Brüggemann S (2015): Team o_O Solution. Available at: https://www.kaggle.com/c/diabetic-retinopathy-detection/discussion/15617. (Accessed on 30 June 2019).
- AREDS Research Group (2001): The age‐related eye disease study system for classifying age‐related macular degeneration from stereoscopic color fundus photographs: the age‐related eye disease study report number 6. Am J Ophthalmol 132: 668–681. [DOI] [PubMed] [Google Scholar]
- Arun CS, Ngugi N, Lovelock L & Taylor R (2003): Effectiveness of screening in preventing blindness due to diabetic retinopathy. Diabet Med 20: 186–190. [DOI] [PubMed] [Google Scholar]
- Burlina P, Freund DE, Dupas B & Bressler N (2011): Automatic screening of age‐related macular degeneration and retinal abnormalities. In: Engineering in Medicine and Biology Society, EMBC, 2011 Annual International Conference of the IEEE: 3962–3966. [DOI] [PubMed]
- Burlina PM, Joshi N, Pekala M, Pacheco KD, Freund DE & Bressler NM (2017): Automated grading of age‐related macular degeneration from color fundus images using deep convolutional neural networks. JAMA Ophthamol 135: 1170–1176. [DOI] [PMC free article] [PubMed] [Google Scholar]
- Chan CK, Gangwani RA, McGhee SM, Lian J & Wong DS (2015): Cost‐effectiveness of screening for intermediate age‐related macular degeneration during diabetic retinopathy screening. Ophthalmology 122: 2278–2285. [DOI] [PubMed] [Google Scholar]
- Chew EY & Schachat AP (2015): Should we add screening of age‐related macular degeneration to current screening programs for diabetic retinopathy?. Ophthalmology 122: 2155–2156. [DOI] [PMC free article] [PubMed] [Google Scholar]
- Chollet F (2017): Xception: Deep learning with depthwise separable convolutions. In Proc IEEE Comput Soc Conf Comput Vis Pattern Recognit: 1251–1258.
- Comer GM, Ciulla TA, Criswell MH & Tolentino M (2004): Current and future treatment options for nonexudative and exudative age‐related macular degeneration. Drugs Aging 21: 967–992. [DOI] [PubMed] [Google Scholar]
- Cuadros J & Bresnick G (2009): EyePACS: an adaptable telemedicine system for diabetic retinopathy screening. J Diabetes Sci Technol 3: 509–516. [DOI] [PMC free article] [PubMed] [Google Scholar]
- Cunha‐Vaz J (1998): Lowering the risk of visual impairment and blindness. Diabet Med 15: S47–S50. [DOI] [PubMed] [Google Scholar]
- Decencière E, Zhang X, Cazuguel G et al. (2014): Feedback on a publicly distributed image database: the Messidor database. Image Anal Stereol 33: 231–234. [Google Scholar]
- Efron B & Tibshirani RJ (1993): An introduction to the bootstrap. Boca Raton, FL: Chapman & Hall/CRC: 202–236. [Google Scholar]
- Gargeya R & Leng T (2017): Automated identification of diabetic retinopathy using deep learning. Ophthalmology 124: 962–969. [DOI] [PubMed] [Google Scholar]
- Gehrs KM, Jackson JR, Brown EN, Allikmets R & Hageman GS (2010): Complement, age‐related macular degeneration and a vision of the future. Arch Ophthalmol 128: 349–358. [DOI] [PMC free article] [PubMed] [Google Scholar]
- Grassmann F, Mengelkamp J, Brandl C et al. (2018): A deep learning algorithm for prediction of age‐related eye disease study severity scale for age‐related macular degeneration from color fundus photography. Ophthalmology 125: 1410–1420. [DOI] [PubMed] [Google Scholar]
- Guariguata L, Whiting DR, Hambleton I, Beagley J, Linnenkamp U & Shaw JE (2014): Global estimates of diabetes prevalence for 2013 and projections for 2035. Diabetes Res Clin Pract 103: 137–149. [DOI] [PubMed] [Google Scholar]
- Gulshan V, Peng L, Coram M et al. (2016): Development and validation of a deep learning algorithm for detection of diabetic retinopathy in retinal fundus photographs. JAMA 316: 2402–2410. [DOI] [PubMed] [Google Scholar]
- Harmon D & Merritt J (2009): Demand for ophthalmic services and ophthalmologists–a resource assessment. In: A Study Prepared by Market Scope. LLC 1‐2.
- Hernández RA, Burr JM & Vale LD (2008): Economic evaluation of screening for open‐angle glaucoma. Int J Technol Assess Health Care 24: 203–211. [DOI] [PubMed] [Google Scholar]
- Hripcsak G & Heitjan DF (2002): Measuring agreement in medical informatics reliability studies. J Biomed Inform 35: 99–110. [DOI] [PubMed] [Google Scholar]
- Huang G, Liu Z, Van Der Maaten L & Weinberger KQ (2017): Densely connected convolutional networks. In Proc IEEE Comput Soc Conf Comput Vis Pattern Recognit: 4700–4708.
- IAPB (2016): Diabetic retinopathy. Available at: https://www.iapb.org/knowledge/what-is-avoidable-blindness/diabetic-retinopathy. (Accessed on 4 March 2019).
- IDF (2017): IDF Diabetes Atlas 8th Edition 2017. Available at: http://www.diabetesatlas.org. (Accessed on 4 March 2019).
- Jain S, Hamada S, Membrey WL & Chong V (2006): Screening for age‐related macular degeneration using nonstereo digital fundus photographs. Eye 20: 471. [DOI] [PubMed] [Google Scholar]
- James M, Turner D, Broadbent DM, Vora J & Harding SP (2000): Cost effectiveness analysis of screening for sight threatening diabetic eye disease. BMJ 320: 1627–1631. [DOI] [PMC free article] [PubMed] [Google Scholar]
- Jones S & Edwards RT (2010): Diabetic retinopathy screening: a systematic review of the economic evidence. Diabet Med 27: 249–256. [DOI] [PubMed] [Google Scholar]
- Karnon J, Czoski‐Murray C, Smith K et al. (2008): A preliminary model‐based assessment of the cost–utility of a screening programme for early age‐related macular degeneration. In: NIHR Health Technology Assessment programme: Executive Summaries. NIHR Journals Library. [DOI] [PubMed]
- Krizhevsky A, Sutskever I & Hinton GE (2012): Imagenet classification with deep convolutional neural networks. In: Advances in neural information processing systems: 1097–1105.
- LaTIM (2011): Messidor‐2 dataset. Available at: http://latim.univ-brest.fr/indexfce0.html. (Accessed on 4 March 2019).
- LeCun Y, Bottou L, Bengio Y & Haffner P (1998): Gradient‐based learning applied to document recognition. Proc IEEE 86: 2278–2324. [Google Scholar]
- LeCun Y, Bengio Y & Hinton G (2015): Deep learning. Nature 521: 436. [DOI] [PubMed] [Google Scholar]
- Li Z, Keel S, Liu C et al. (2018): An automated grading system for detection of vision‐threatening referable diabetic retinopathy on the basis of color fundus photographs. Diabetes Care 41: 2509–2516. [DOI] [PubMed] [Google Scholar]
- Litjens G, Kooi T, Bejnordi BE et al. (2017): A survey on deep learning in medical image analysis. Med Image Anal 42: 60–88. [DOI] [PubMed] [Google Scholar]
- NEI . AREDS dbGaP Data Tables: A User's Guide. Version 1.0. Available at: https://www.ncbi.nlm.nih.gov/projects/gap/cgi-bin/GetPdf.cgi?id=phd001552.1. (Accessed on 4 March 2019).
- NEI . AREDS dbGaP Study Accession. Available at: https://www.ncbi.nlm.nih.gov/projects/gap/cgi-bin/study.cgi?study_id=phs000001.v3.p1. (Accessed on 4 March 2019).
- NEI . AREDS Manual of Operations Study Design. Section 3.1.2.8. Available at: https://www.ncbi.nlm.nih.gov/projects/gap/cgi-bin/GetPdf.cgi?id=phd000003.2. (Accessed on 4 March 2019).
- NHS (2014): Diabetic Eye Screening Programme. Available at: https://www.gov.uk/topic/population-screening-programmes/diabetic-eye. (Accessed on 4 March 2019).
- NOG (2017): Diabetic retinopathy, multidisciplinary guideline, authorized November 2017. Available at: https://www.oogheelkunde.org/richtlijn/diabetische-retinopathie-multidisciplinaire-richtlijn-geautoriseerd-November-2017. (Accessed on 4 March 2019).
- Ouyang Y, Heussen FM, Keane PA, Sadda SR & Walsh AC (2013): The retinal disease screening study: prospective comparison of nonmydriatic fundus photography and optical coherence tomography for detection of retinal irregularities nonmydriatic FP versus OCT. Invest Ophthalmol Vis Sci 54: 1460–1468. [DOI] [PMC free article] [PubMed] [Google Scholar]
- Pascolini D & Mariotti SP (2012): Global estimates of visual impairment: 2010. Br J Ophthalmol 96: 614–618. [DOI] [PubMed] [Google Scholar]
- Peng Y, Dharssi S, Chen Q, Keenan TD, Agrón E, Wong WT, Chew EY & Lu Z (2018): DeepSeeNet: a deep learning model for automated classification of patient‐based age‐related macular degeneration severity from color fundus photographs. Ophthalmology 126: 565–575. [DOI] [PMC free article] [PubMed] [Google Scholar]
- Piñero DP (2013): Screening for eye disease: our role, responsibility and opportunity of research. J Optom 6: 67–68. [Google Scholar]
- Raman R, Srinivasan S, Virmani S, Sivaprasad S, Rao C & Rajalakshmi R (2018): Fundus photograph‐based deep learning algorithms in detecting diabetic retinopathy. Eye 33: 97–109. [DOI] [PMC free article] [PubMed] [Google Scholar]
- Rowe S, MacLean CH & Shekelle PG (2004): Preventing visual loss from chronic eye disease in primary care: scientific review. JAMA 291: 1487–1495. [DOI] [PubMed] [Google Scholar]
- Sánchez CI, Niemeijer M, Dumitrescu AV, Suttorp‐Schulten MS, Abramoff MD & van Ginneken B (2011): Evaluation of a computer‐aided diagnosis system for diabetic retinopathy screening on public data. Invest Ophthalmol Vis Sci 52: 4866–4871. [DOI] [PubMed] [Google Scholar]
- Schmidt‐Erfurth U, Sadeghipour A, Gerendas BS, Waldstein SM & Bogunović H (2018): Artificial intelligence in retina. Prog Retin Eye Res 67: 1–29. [DOI] [PubMed] [Google Scholar]
- Shaw JE, Sicree RA & Zimmet PZ (2010): Global estimates of the prevalence of diabetes for 2010 and 2030. Diabetes Res Clin Pract 87: 4–14. [DOI] [PubMed] [Google Scholar]
- Simonyan K & Zisserman A (2014): Very deep convolutional networks for large‐scale image recognition. arXivpreprint arXiv:1409.1556. [Google Scholar]
- Szegedy C, Liu W, Jia Y et al. (2015): Going deeper with convolutions. In Proc IEEE Comput Soc Conf Comput Vis Pattern Recognit: 1–9.
- Szegedy C, Ioffe S, Vanhoucke V & Alemi AA (2017): Inception‐v4, inception‐resnet and the impact of residual connections on learning. In AAAI 4: 12. [Google Scholar]
- Ting DSW, Cheung CYL, Lim G et al. (2017): Development and validation of a deep learning system for diabetic retinopathy and related eye diseases using retinal images from multiethnic populations with diabetes. JAMA 318: 2211–2223. [DOI] [PMC free article] [PubMed] [Google Scholar]
- United Nations Department of Economic and Social Affairs (2017): World Population Aging Report 2017. Available at: http://www.un.org/en/development/desa/population/publications/. (Accessed on 4 March 2019).
- University of Iowa Health Care , Department of Ophthalmology and Visual Sciences, Michael D. Abràmoff, MD, PhD (2017). Available at: https://medicine.uiowa.edu/eye/abramoff. (Accessed on 4 March 2019).
- WHO (2013): Global action plan for the prevention of avoidable blindness and visual impairment 2014–2019 – towards universal eye health. Available at: https://www.iapb.org/advocacy/global-action-plan-2014-2019. (Accessed on 4 March 2019).
- Wilkinson CP, Ferris FL, Klein RE et al. (2003): Proposed international clinical diabetic retinopathy and diabetic macular edema disease severity scales. Ophthalmology 110: 1677–1682. [DOI] [PubMed] [Google Scholar]
- Wong WL, Su X, Li X et al. (2014): Global prevalence of age‐related macular degeneration and disease burden projection for 2020 and 2040: a systematic review and meta‐analysis. Lancet Glob Health 2: e106–e116. [DOI] [PubMed] [Google Scholar]
- Wormald R (1999): Epidemiology in practice: screening for eye disease. Community Eye Health 12: 29. [PMC free article] [PubMed] [Google Scholar]
- Yau JW, Rogers SL, Kawasaki R et al. (2012): Global prevalence and major risk factors of diabetic retinopathy. Diabetes Care 35: 556–564. [DOI] [PMC free article] [PubMed] [Google Scholar]
- Zarbin MA & Rosenfeld PJ (2010): Pathway‐based therapies for age‐related macular degeneration: an integrated survey of emerging treatment alternatives. Retina 30: 1350–1367. [DOI] [PubMed] [Google Scholar]
- Zweig MH & Campbell G (1993): Receiver‐operating characteristic (ROC) plots: a fundamental evaluation tool in clinical medicine. Clin Chem 39: 561–577. [PubMed] [Google Scholar]
Associated Data
This section collects any data citations, data availability statements, or supplementary materials included in this article.
Supplementary Materials
Figure S1. Extraction of the DR‐AMD dataset.
Figure S2. Receiver operating characteristic curves for individual detection of referable DR and AMD in the DR‐AMD dataset.
Figure S3. Interrater disagreement in DR grading stages among independent human observers and reference standard in Messidor (1200 images).
Figure S4. Receiver operating characteristic curve for individual detection of referable DR in Messidor‐2 (874 subjects).
Table S1. Diagnostic performance for individual detection of referable DR and AMD of RetCAD v.1.3.0 and observers compared with reference standard in the DR‐AMD dataset.
Table S2. Diagnostic performance for individual detection of referable DR of RetCAD v.1.3.0 and observers compared with reference standard in Messidor (1200 images).
Table S3. Diagnostic performance for individual detection of referable AMD of RetCAD v.1.3.0 compared with reference standard in the AREDS dataset (133821 images).
Table S4. Diagnostic performance for individual detection of referable DR of RetCAD v.1.3.0 compared with reference standard in Messidor‐2 (874 subjects).
Appendix S1. Validation of individual detection of referable DR in Messidor‐2.