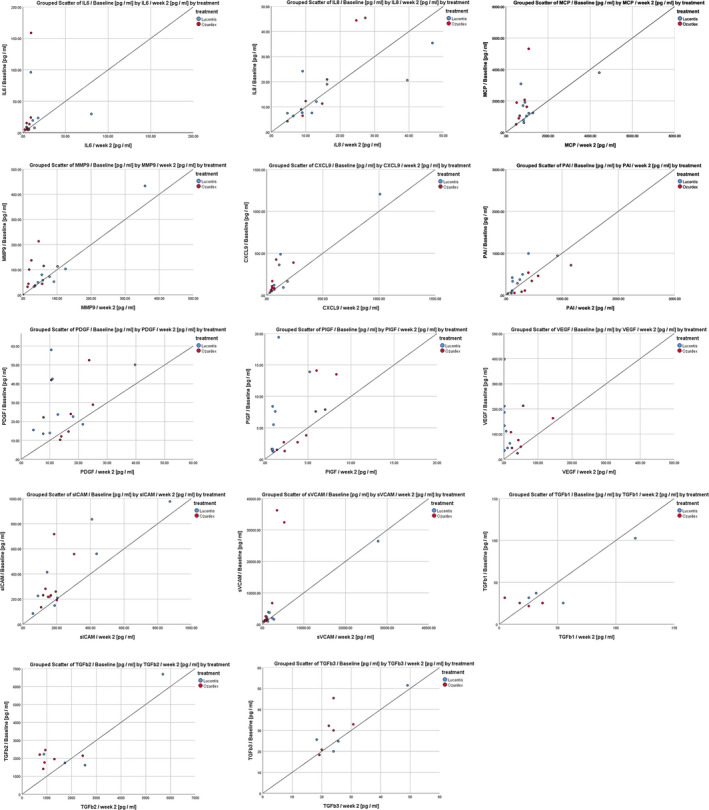
Figure 1.

Scatter plots demonstrating the correlation between inflammatory markers at baseline and week 2 (visit 3) for ranibizumab (blue) and the dexamethasone implant (red), respectively. First line left: IL‐6 (interleukin‐6) levels baseline compared with week 2; first line middle: IL‐8 (interleukin 8); first line right: MCP‐1 (monocyte chemo‐attractant protein 1); second line left: MMP‐9 (matrix metallopeptidase 9); second line middle: MIG/CXCL9 (monokine induced by gamma interferon); second line right: PAI‐1 (plasminogen activator inhibitor‐1); third line left: PDGF (platelet‐derived growth factor); third line middle: PIGF (placental growth factor); third line right: VEGF (vascular endothelial growth factor); fourth line left: sICAM‐1 (soluble intercellular adhesion molecule 1); fourth line middle: sVCAM (soluble vascular cell adhesion protein); fourth line right: TGFb1 (transforming growth factor beta 1); fifth line left: TGFb2 (transforming growth factor beta 2); and fifth line middle: TGFb3 (transforming growth factor beta 3).
