Figure 6.

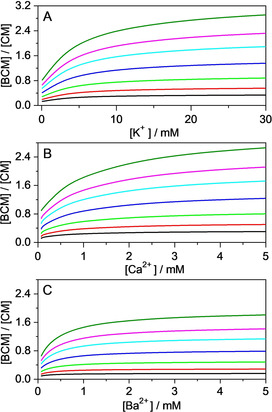
Variation of B+–CB7–Mn+/ CB7–Mn+ molar ratios in equilibrium as a function of A) K+, B) Ca2+ and C) Ba2+ concentrations in equimolar solutions of B+ and CB7. [B+]=[CB7]=15, 10, 7, 4, 2, 1, and 0.5 μm (from top to bottom).

Variation of B+–CB7–Mn+/ CB7–Mn+ molar ratios in equilibrium as a function of A) K+, B) Ca2+ and C) Ba2+ concentrations in equimolar solutions of B+ and CB7. [B+]=[CB7]=15, 10, 7, 4, 2, 1, and 0.5 μm (from top to bottom).