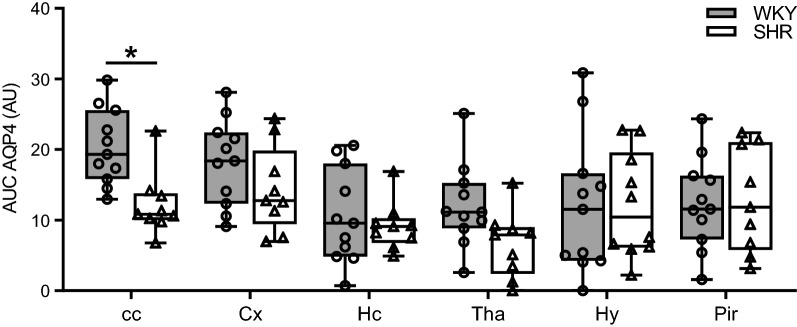
Fig. 6.
Quantification of AQP4 expression in different anatomical structures. The area under the curve (AUC) of the AQP4 intensity profile of capillaries was significantly lower in the corpus callosum in SHR (n = 10) compared to WKY (n = 11). All other structures were not different between the two strains. The boxplots indicate the median and values of the 25th and 75th percentile of the data. *p ≤ 0.05 (two-way ANOVA with Bonferroni’s post hoc tests). cc, corpus callosum; Cx, cerebral cortex; Hc, hippocampus; Tha, thalamus; Hy, hypothalamus; Pir, piriform cortex

